Authors: Cole Alder, Leslie Alanis, Megan Raisle, Eric Nost, Kelsey Breseman, Sara Wylie
Participants from 1st and 2nd workshops, respectively
Last Thursday 20+ organizers, students, activists and academics gathered for the second of four online workshops to practice our right to know about environmental hazards together by making congressional district report cards on industry compliance with and EPA enforcement of environmental laws.
Building on EDGI’s findings that enforcement of environmental laws dropped precipitously under the Trump administration, we are developing report cards for each member of Congress involved in the House and Senate Committees responsible for EPA oversight (the House Energy and Commerce Committee and the Senate Environment and Public Works Committee). These Environmental Enforcement Watch or “EEW” Report Cards provide members of Congress and their constituents with data on violations of environmental laws, facility inspections, and enforcement actions in their districts since 2001. As the EPA is mandated by Congress to enforce environmental laws, we aim to provide legislators with an informative analysis based on EPA’s own data of compliance with and enforcement of environmental laws in the districts they serve.
To produce these report cards, we are hosting public events where people can contribute to the project by reviewing raw data, identifying data errors, noting key findings and highlighting questions for further research. We also gather feedback on the report card design; ideas for further developing the data science; stories from participants about why they care about enforcement of environmental laws; and interest/strategy for building EEW into a grassroots coalition.
In the first Public Hours workshop on August 20th, we introduced EEW data tools, looked at national trends in environmental enforcement and compliance, and considered what an effective EEW coalition might look like. Last week, on August 27th, we hosted EEW’s second workshop which involved a more targeted, action-oriented approach—examining ECHO data for congressional districts represented by the Chair (Frank Pallone, NJ-6), Vice Chair (Yvette Clark, NY-9), and Ranking Member (Greg Walden, OR-2) of the House Energy & Commerce Committee, as well as the Chair (Diana DeGette, CO-1) and Ranking Member (Brett Guthrie, KY-2) of its subcommittee on Oversight and Investigations.
Breaking into five small groups (one for each district), we gathered environmental enforcement and compliance data for these districts from EPA’s Enforcement and Compliance History Online (ECHO) database using customized Jupyter Notebooks (a data science tool) and reviewed that data in preliminary draft report cards developed using markdown in R (a coding language). In these groups, we discussed the report’s findings and considered the political, environmental, and public health implications. As momentum and participation in this project grows, we aim to finalize and publicize congressional report cards for each of the 76 members of both congressional committees responsible for EPA oversight.
To our knowledge, there are no report cards that detail EPA enforcement in congressional districts. As each district across the country has a different number of regulated facilities, EDGI is developing metrics within the report cards that allow comparison between districts. Two metrics we are testing are Clean Water Act (CWA) inspections and CWA effluent violations per 1000 facilities. Using national data is a baseline, the bar graph below visualizes these metrics using two congressional districts (Colorado 1st & Kentucky 2nd) that were investigated during the workshop.
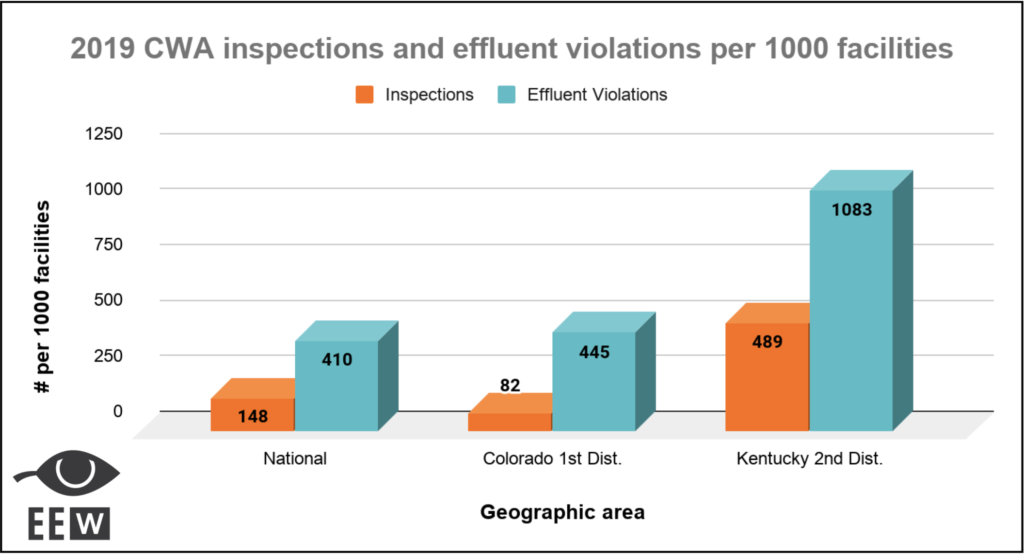
Nationally, there were surprisingly few inspections in 2019, just 148 per 1000 facilities. Meanwhile, there were 410 CWA effluent violations per 1000 facilities nationally. Effluent violations occur when more of a regulated chemical is found in a facility’s wastewater than the facility is permitted to emit. Effluent or wastewater violations are a relatively reliable kind of EPA data as they are directly measured in a facility’s wastewater. EPA’s data shows that for every 1000 facilities nationally there were approximately 410 measured exceedances of permitted emissions in facilities’ wastewater.
Congressional districts, our early work shows, can vary significantly from those national averages. For instance, in Colorado’s 1st District, currently represented by Diana DiGette (D), there were fewer CWA inspections than the national average – just 82 per 1000 facilities – while there were more effluent violations – 445 per 1000 facilities in 2019. By contrast, Kentucky’s 2nd District, represented by Brett Guthrie (R), had significantly more inspections – 489 per 1000 facilities – than the national rate, and dramatically more violations – 1083 per 1000 facilities. Using metrics like these we hope to illuminate for the public and their representatives the shared and uneven problem of insufficient compliance with and enforcement of the environmental laws that protect our air and water.
After exploring the data, we reconvened as a larger group to compare findings for each district, consider the local political and economic contexts behind them, discuss the problems and inconsistencies within ECHO data, and propose recommendations for further research and action.
Following this open discussion on our congressional district findings, we again divided into four breakout groups based on attendee interests and skill sets. In the Constituent Oriented Storytelling group, attendees worked with an EEW team member, Leslie, to connect their personal experiences with environmental injustice to the enforcement/compliance data discussed above, and to clarify the policy changes they would like to see. During the Storytelling process in Workshop 1, one participant who grew up in Houston discussed how she had been impacted by the lack of environmental enforcement:
“I didn’t realize how disproportionately this city is affected by both climate change (extreme weather events) and general pollution—I took this all to be the norm. Large hurricanes became increasingly normalized as were ailments like asthma that can be attributed to poor air quality and have only increased in frequency.”
In another breakout group, attendees worked with Megan to begin drafting congressional reports for their own districts. In the Data Science and Visualization group, attendees offered feedback on how to improve the elegance and accessibility of the draft congressional reports and Jupyter Notebooks, and worked with EEW’s Lourdes, Steve, and Leif to brainstorm creative and poignant visualizations. In the Coalition Building and Strategy breakout group, workshop attendees with community organizing experience spoke with team members Casey and Cole, and coordinator Sara, around how EEW data tools and personnel can support frontline communities in their fights for environmental justice.
We are beyond grateful to everyone who has attended our first two public workshops. Their passion and commitment to environmental justice, to their homes, families, and communities, are crucial to bringing meaning and action to the crisis in compliance and enforcement that these data help reveal. We look forward to continued collaboration with those who are interested, and invite others with similar convictions to join this effort to protect and uplift each other and our shared environment. This week we’ll be reviewing draft report cards for the rest of the House Energy and Commerce Subcommittee on Oversight and Investigations (register here). Together, we can hold industry and environmental regulators accountable. #YouCanEEWToo