By Leif Fredrickson
On Friday, the Environmental Protection Agency (EPA) released the much-anticipated annual report of its Office of Enforcement and Compliance Assurance (OECA). The report, titled “EPA Enforcement Annual Results 2018,” highlighted a few of OECA’s figures for 2018 and asserted that “a strong enforcement and compliance assurance program is essential to achieving positive public health and environmental outcomes.”
But while OECA’s report declared that its enforcement program was strong, the data it reported about itself conveys just the opposite. Compared to past data on EPA enforcement – published in the agency’s own reports – fiscal year 2018 was one of the weakest, perhaps the weakest, enforcement year in decades.
Assessing overall EPA enforcement is a challenge because the agency enforces across a variety of environmental media and environmental laws. Moreover, enforcement is a process, with different measurements for different parts of that process. Some measures are certainly more important than others. Overall measures of enforcement cases or costs of compliance, for example, are more indicative of strong enforcement than narrower measures, such as the cleanup of contaminated soil. But there is no single measure that tells all.
Instead, it is necessary to look at the measures holistically, to see how the EPA is doing at different points in its enforcement process. In what follows, we will take a tour through EPA’s main enforcement process and see how EPA enforcement actions in 2018 compare to previous years. (Links to sources and data available on request).
Inspections
To begin enforcement, EPA must identify facilities that are in non-compliance (for example, emitting more mercury from an incinerator than is allowed under the law). There are several ways that non-compliance can come to the attention of the agency, but inspections by EPA staff are a critical tool and the place where a strong enforcement program begins. However, the EPA conducted only 10,612 inspections in 2018, the lowest in 25 years (since 1994). EPA did not record inspections numbers before 1994, so 2018 inspections are actually the lowest inspection counts on record. EPA’s 2018 inspection numbers are nearly half as much (55%) of the average annual number of inspections from 1994 to 2016 (19,200).
Civil Cases
Another critical measure of enforcement strength is the number of cases initiated and the number concluded. If inspections or other monitoring find non-compliance, EPA typically initiates an enforcement case. For civil violations, the EPA may issue an administrative order requiring the facility to come into compliance and possibly pay a penalty. For more serious civil cases, the EPA may take the violator to court. This is called a civil judicial case. The Department of Justice (DOJ) handles civil judicial cases, so when these cases are initiated they are counted as civil judicial referrals to the DOJ. Total civil case initiations are counted by adding up administrative cases (Administrative Penalty Order Complaints and Administrative Compliance Orders) and civil judicial referrals. When EPA finalizes an administrative order or a court case is settled, these cases are considered concluded. Total civil case conclusions are thus counted by adding up Final Administrative Penalty Orders and Administrative Compliance Orders (the latter are counted in both initiations and conclusion) and concluded civil judicial cases.
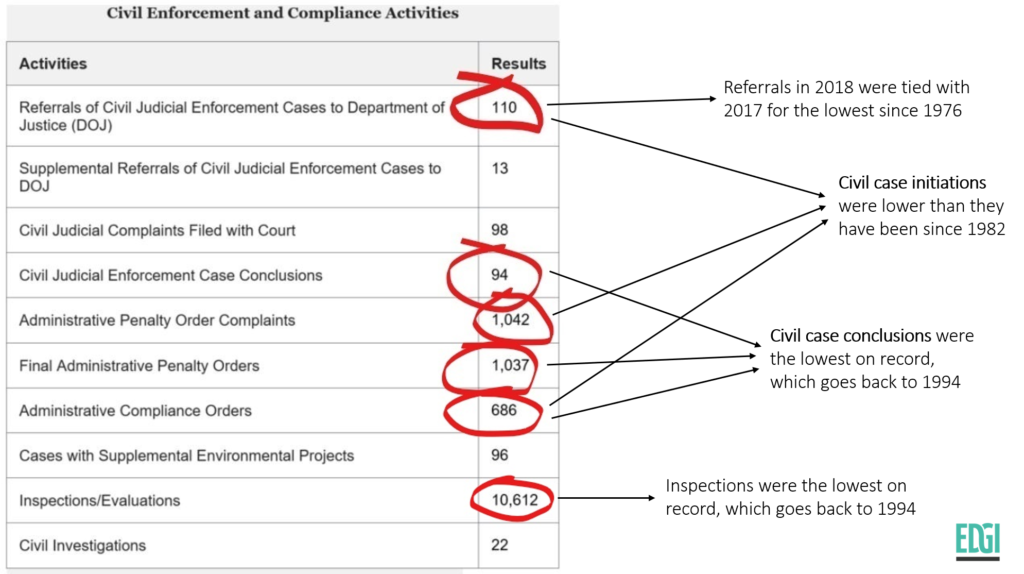
Screenshot of EPA’s annual report on enforcement and compliance for fiscal year 2018 with annotations corresponding to EDGI’s analysis. As the annotations show, EPA’s civil enforcement numbers show weak enforcement in the past fiscal year.
Civil Cases Initiated in 2018
Shockingly, the number of civil case initiations in 2018 was just 1,838, lower than any year going back to 1982. In other words, civil case initiations in 2018 were the lowest they have been in 36 years. They were just 58% of the average annual number of cases from 1973 to 2016 (3,171). (In order to better compare the Trump administration to past administrations, averages in this analysis do not include fiscal years 2017 and 2018).
Civil Judicial Referrals in 2018
Civil judicial referrals make up a small part of the overall initiations, but they are the most serious civil cases. There were only 110 civil judicial referrals each year in 2017 and 2018. One has to go back in the record four decades, to 1976, to find a year with fewer civil judicial referrals than 2017 and 2018. Even including the EPA’s fledging years in 1973 and 1974 when there were only a couple of judicial referrals, the average annual number of referrals from 1973 to 2016 was still 239, more than double the number of referrals in 2017 and 2018.
Civil Cases Concluded in 2018
Data on civil conclusions also indicates weak enforcement. At just 1,817 civil cases concluded in 2018, this past year was the lowest on record, with data stretching back to 1994. 2018’s conclusions were just 53% of the average number of civil conclusions from 1994 to 2016.
In sum, civil cases in 2018 — both those initiated and those concluded — were the lowest on record going back several decades. The most serious civil cases, those referred to the DOJ, were extraordinarily low in 2017 and 2018 — the lowest they have been in 42 years.
Criminal Cases and Defendants
Some environmental law violations are violations of criminal law. These, too, are very serious cases and so the count of these cases also indicates strong enforcement. In 2018, EPA opened 129 criminal cases, up from 115 cases in 2017. But 2017 was an extremely low year for criminal cases opened. The numbers for this past year are thus not strong: 2018 had the second lowest number of criminal cases opened since 1992. The number of criminal cases opened in 2018 was less than half of the average number of cases from 1989 to 2016 (308).
Similarly, the number of criminal defendants charged in 2018 (105) was the lowest since 1991. That number, too, is less than half the average number of defendants charged from 1989 to 2016 (242).
Fines
In addition to assessing the number of cases, it is important to look at the outcomes of cases. Fines resulting from EPA cases are an important indicator of enforcement strength, since significant penalties are an important deterrent against illegal pollution. In addition, large penalties can indicate that EPA is pursuing big cases that may have significant implications for the environment or public health.
In 2018, criminal fines totaled about $86 million. That is somewhere in the middle of pack (the median) for penalties from 1989 to 2016 (i.e., the administrations of George H. Bush, Bill Clinton, George W. Bush, and Barack Obama). In inflation-adjusted dollars, 2018’s criminal penalties are below the average of the four previous presidential administrations.
Civil penalties totaled about $69 million in 2018. Just in nominal dollars — the amount before adjusting for inflation — that is lower than civil penalties have been since 1990. Adjusted for inflation, 2018’s civil penalties are lower than they have been since 1987 – the lowest in more than 30 years.
Criminal Sentences
In addition to fines, another way of assessing criminal cases is through years of incarceration for people found guilty of criminal environmental violations. One of the figures that EPA highlighted in its overview of enforcement activities in 2018 was the total of 73 years of incarceration for criminal defendants. It is an odd measure to highlight, however, because in historical perspective, 2018 is the fifth lowest year since 1989. It is also well below average. 2018’s count of years of incarceration is just 62% of the average for the previous four presidential administration (1989 – 2016).
Compliance Costs (Injunctive Relief)
Another way of assessing civil cases is through the compliance costs incurred by violators. Typically when EPA finds a facility that is out of compliance, it forces the violator to change its processes or technology so that the facility is no longer in violation of the law. The EPA estimates how much it costs the violator to come into compliance. Compliance cost (or what is sometimes called the value of injunctive relief) is an important indicator of the extent to which EPA has forced violators to actually change how the operate in order to pollute less and protect public health and the environment.
In 2018, EPA cases resulted in about $3.95 billion in compliance costs. That is the third lowest in twenty years. Adjusted for inflation, the average annual compliance costs between 1994 (the earliest recording by EPA) and 2016 were about twice as much ($7.74 billion in 2018 dollars) as they were in 2018.
Environmental Benefits
A final measure of enforcement is the estimated environmental benefits that come from enforcement. These estimates tally how much pollution and waste and were reduced or prevented, how much water and soil was cleaned up, and how many people were protected from unsafe drinking water (among other things).
As EDGI has previously shown, the combined pollution and hazardous waste reduction of 809 million pounds in 2018 that EPA has trumpeted is not actually very impressive. It was the second lowest on record since data collection began in 2008. The lowest year was 2017.
Comparable data for pollution reduction alone goes back to 2002. Since 2002, the 2018 pollution reduction (268 million pounds) was the third lowest on record, and is less than a quarter of the average pollution reduction from 2002 to 2016.
Cubic yards of contaminated soil cleaned up was close to the median for data that stretches back to 2004, but well below the average for 2004 to 2016. Cubic yards of contaminated water cleaned up in 2018 was just 35% of the average cleanup for 2004 to 2016.
In 2018, about 505,000 people were protected by Safe Drinking Water Act enforcement. That is the third lowest amount since the EPA began collecting this sort of data in 2002. It is less than 9% of the average number of people protected by Safe Drinking Water Act enforcement from 2002 to 2016.
A Holistic View of EPA Enforcement in 2018
At virtually every point in the enforcement process, and across different types of enforcement cases, outcomes and benefits, EPA enforcement appears extremely weak rather than strong. Many key measures are at the lowest they have been in over a quarter century, and in some cases lower than they have been since the early 1980s and late 1970s. Other key measures are, if not at the bottom compared to the past few decades, very close to the bottom or below the average for past administrations. This approach to enforcement appears to put public health and positive environmental outcomes in jeopardy, rather than in safe hands.
This is no surprise. As EDGI documented in its report, “A Sheep in the Closet: The Erosion of Enforcement at the EPA,” agency staff told us that they have been discouraged from doing enforcement by the anti-regulatory rhetoric of EPA leadership, the leadership’s close ties to industry, the leadership’s directives to defer to states, and the leadership’s increased political oversight of enforcement. EPA leadership itself has acknowledged, in internal documents we obtained, that the aforementioned factors may have had a “chilling effect” on enforcement staff. In addition, both agency employees and internal EPA documents have suggested that low staff numbers and resources have hobbled enforcement. These staff interviews and internal documents, along with EPA’s own numbers, indicate that the agency is relinquishing its role as a strong enforcer of public and environmental health.