By Leif Fredrickson
On January 28th, the Environmental Protection Agency (EPA) released its “Year in Review” report for 2018. The report outlines the “major accomplishments and environmental progress during the Trump administration,” according to the agency, showing that “America is on a path to a stronger, safer, and cleaner future.”
Among the key accomplishments the EPA highlights in the report, press release, and tweets is the “treatment, disposal, or elimination of 809 million pounds of pollutants and waste,” in fiscal year (FY) 2018, which is “almost twice as much as FY 2017.” Acting Administrator Andrew Wheeler has likewise brandished this metric in the media and in his confirmation hearing before the Senate on January 16 in order to fend off criticism of EPA enforcement.
Contrary to the claims of Wheeler and the EPA’s “Year in Review” report, however, America does not appear to be on a path to a safer and cleaner future: The pollution and waste reduction numbers for the past two years under the Trump administration are the worst on record, going back to 2008.
Just what are these metrics that Wheeler and the EPA are now touting?
During the administration of Bill Clinton, the EPA began tracking pollution reduction resulting from its enforcement actions, along with traditional measures of enforcement, such as cases, penalties, and compliance costs. The idea was to measure the outcome of enforcement actions — the “benefits” of enforcement, as the agency often says — not just the actions themselves. For example, after the agency issued an order of compliance requiring the installation of a wet scrubber on a factory smokestack, it would estimate how many pounds of mercury would be prevented from being emitted when the company complied with the order. Systematic attempts at this measurement began in 1995, but what data was collected, and how it was categorized and reported, has changed over time.
By 2008, the EPA was reporting pollution reductions in a way that corresponds to the EPA’s current accounting resulting in its 809 million pounds number. That number is the sum of two categories: 1) “Pollution Reduced, Treated or Eliminated”; and 2) “Hazardous Waste Reduced, Treated, or Properly Disposed of.” The “Year in Review” for FY 2018 reports these two numbers as “nearly” 268 million pounds and “over” 540 million pounds, respectively (17). Together, those yield about 809 million pounds.
Compared to FY 2017 numbers, these numbers for pollution reduction (by which I mean the combined pollution and hazardous waste categories above) are an improvement. In that year, only 217 million pounds of pollution was reduced, treated or eliminated, and only 245 million pounds of hazardous waste treated, minimized, or properly disposed of. The total for FY 2017 was thus 462 million pounds of pollution reduction, or a bit more than half of the reduction in FY 2018.
But wait — FY 2017 is also primarily a Trump administration year. What do the Trump years of 2017 and 2018 look like in a slightly longer term perspective?
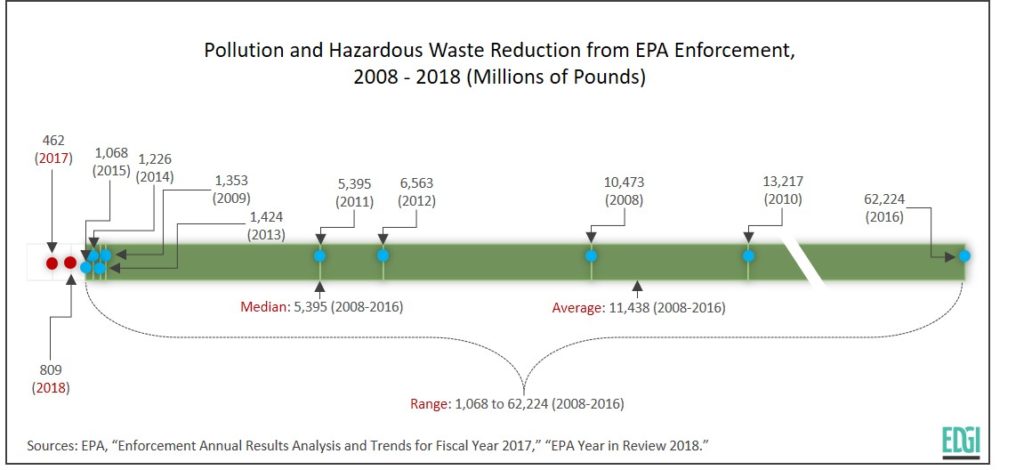
Let’s go back one more year, to FY 2016. In that year, the combined pollution reduction was 62,224 million pounds. That is about fifty times as large as the pollution reductions in fiscal years 2017 and 2018 combined.
Fiscal year 2016 is, however, truly an outlier. It is by far the largest pollution reduction year on record since 2008. However, pollution reduction in all of the other years, from 2008 to 2015, are also larger than fiscal years 2017 and 2018. In most cases, pollution reductions in any one year during this time period are larger than during the two years under the Trump administration.
Using Wheeler’s preferred combination of the categories for pollution and hazardous waste reduction, fiscal years 2017 and 2018 are the lowest on record. They are outside the range of values for 2008 to 2016, and they are a very long ways from the median and average (mean) values for those years. Given the 2016 outlier, the median of 5,395 million pounds is probably the best measure of the central tendency for 2008 to 2016. Wheeler’s much trumpeted number of 809 million pounds of pollution and waste reduced is thus a mere 15% of the median for 2008 to 2016, and 2017 is even worse, at less than 9% of the median. (For full set of data from 2008 to 2018, see the table at the end).
Wheeler and the EPA appear to have latched onto pollution reduction numbers as a result of reports indicating that “traditional measures” of EPA’s enforcement in 2018 are dismal. Public Employees for Environmental Responsibility, former OECA head Cynthia Giles, and our group, the Environmental Data & Governance Initiative (EDGI), have contributed analyses showing declines in criminal and civil enforcement in FY 2018 compared to previous years. And EDGI has analyzed why enforcement has declined, drawing on interviews with staff and internal EPA documents showing that industry influence, staff discouragement, extreme deference to states, political oversight, regulatory uncertainty, and lack of resources have all contributed.
The EPA’s current turn to touting pollution reduction, however, does not offer an enforcement metric that exonerates the Trump EPA’s approach to enforcement. The fact is, the Trump administration years — 2017 and 2018 — are the worst pollution reduction years on record. Fiscal year 2018 pollution reduction numbers only look good in comparison to the worst pollution reduction year on record, fiscal year 2017.
Proclaiming that 2018’s pollution reduction numbers show that EPA enforcement is healthy is like saying, in the midst of the Great Depression, that the unemployment rates for 1934 are healthy because they are better than 1933, the worst unemployment year on record. The boast is absurd when compared to other years.
This administration has sunk environmental health protection into a depression marked by lack of enforcement, regulatory responsibility, and scientific integrity. We are not at all on a path to a safer, cleaner future.