
This figure is from the “Democratizing Data” summary report, put out by EDGI’s Environmental Enforcement Watch in October 2020. It shows the percent change in the average number inspections for the CAA, CWA, and RCRA under the Donald Trump administration (2017-2019) compared to the George W. Bush and Barack Obama administrations (2001-2016). “Same” = 0% change. “Better” = increase of up to 100%. “Much better” = increase of more than 100%. “Worse” = decrease of up to 100%. “Much worse” = decrease of more than 100%. Source: EPA, Enforcement and Compliance History Online.
By Eric Nost, Gretchen Gehrke, Kelsey Breseman
Michael Regan was nominated to be US Environmental Protection Agency (EPA) Administrator by then-President-elect Biden in December 2020 and faces Senate confirmation this week. The enforcement of the US’s most important environmental and public health protection laws, like the Clean Air Act and Clean Water Act, plummeted under Trump. What might we expect from the EPA if Regan is confirmed? Regan’s time as Secretary of the North Carolina Department of Environmental Quality (DEQ) may provide some clues.
Inspections of polluting facilities are critical to environmental law, since they may uncover facilities’ violations of their permits. As its Office of Inspector General revealed last year, US EPA’s actions to ensure compliance declined between 2006 and 2018. Inspections dropped a full 33%, while the number of enforcement cases—written notices, administrative orders, and the like—dropped by over 50%. At the same time, the budget for these activities was cut by about 20%.
These declines mirror what EDGI found in our “Democratizing Data” report. We compared the EPA under the Trump administration (2017 through 2019) to both the Bush and Obama (2001 through 2016) administrations. In the 55 Congressional Districts we examined, the median drop in inspections was 17%, while there was a 28% drop in enforcement actions and 69% decline in the amount of penalties levied against polluters.
All this poses a pressing challenge for the next EPA administrator, especially as COVID-19 continues to disproportionately affect communities of color and low-income communities on the fence lines of facilities that have been given permission to pollute without fear of inspection or legal enforcement or penalty.
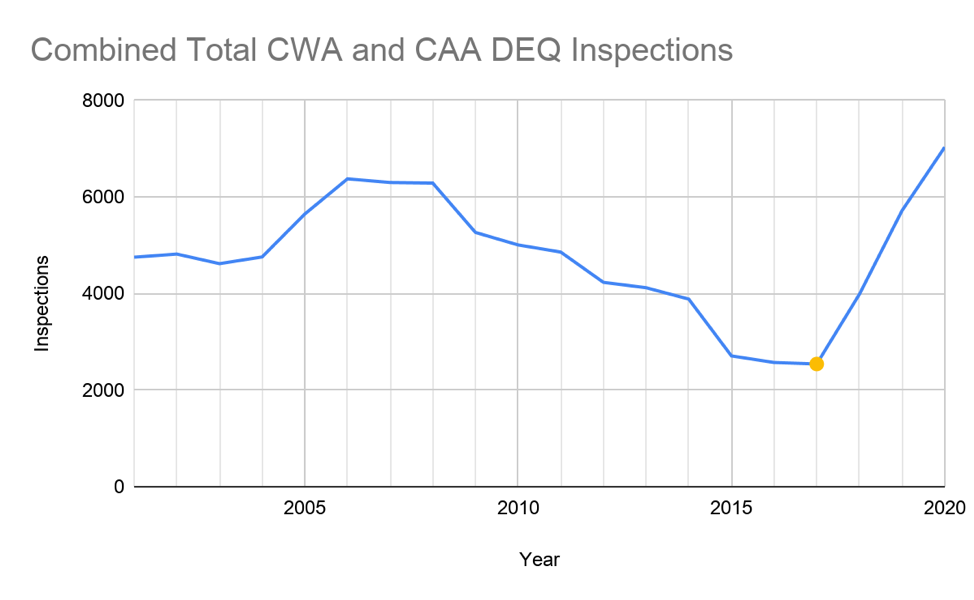
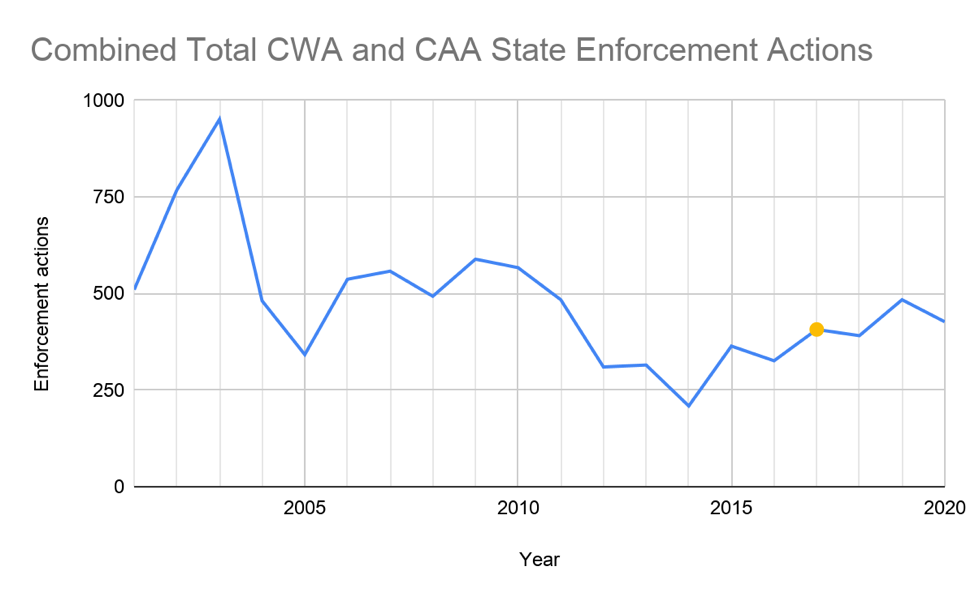
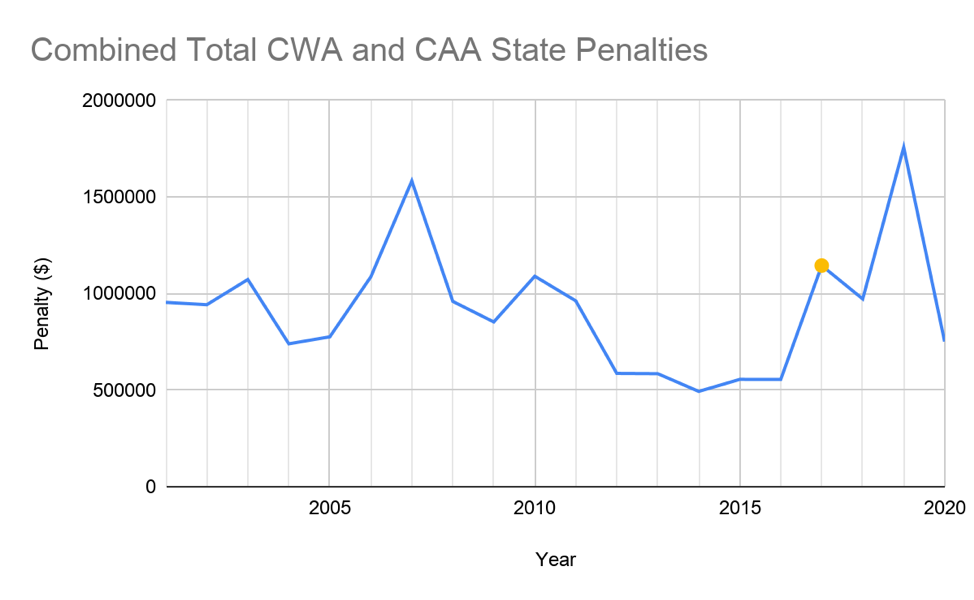
Michael Regan was named NC DEQ Secretary on January 3, 2017, by Governor Roy Cooper. We used data from the EPA’s Enforcement and Compliance History Online (ECHO) public data portal in order to compare DEQ enforcement actions, monetary penalties, and facility inspections under the Clean Water Act and Clean Air Act during Regan’s tenure to those of previous Secretaries.
There is a pattern in both inspections and penalty amounts that tracks with North Carolina’s most recent Republican Governor Pat McCrory (2013-17) and Democratic Governor Roy Cooper (2017-). While the decline in DEQ’s facility inspections did not begin with Pat McCrory, under Roy Cooper, the trend reversed and inspections increased with Regan at the helm of the DEQ. Likewise, there was a greater dollar amount of penalties levied by DEQ during Regan’s oversight than during his predecessor’s. There is less of a clear pattern, however, when it comes to DEQ’s use of other kinds of enforcement actions, such as administrative orders and written notices.
The efficacy of the NC DEQ has been impacted by the state legislature, which determines state agency budgets. Republicans held veto-proof supermajorities in both the NC Senate and NC House of Representatives 2010-2018, and have retained a majority in both chambers since 2018. North Carolina had Democratic governors from 2001 to 2013 and legislative chambers that were narrowly controlled by Democrats for most of the first decade of this century. The period of Republican supermajorities in the NC state legislature coincided with a plummet in NC DEQ inspections, enforcement actions, and penalties levied. Given this context, the performance of the NC DEQ during Regan’s tenure is even more compelling.
This is a surface-level analysis of trends in a district that could be impacted by many other factors; it’s possible that the timing with Regan’s tenure is incidental, and this bears further investigation. Nonetheless, the rise in inspections in North Carolina under Regan’s tenure as Secretary of the DEQ is promising.
Our research is available in this Jupyter Notebook, which members of the public are welcome to explore. As part of EDGI’s Environmental Enforcement Watch project, we have maintained a copy of EPA’s ECHO database for the past year and developed novel data tools that allow analysis not otherwise possible via the ECHO website.