
Authors
Eric Nost, Kelsey Breseman, Steve Hansen, Leslie Alanis, Megan Raisle, Lourdes Vera, Maalvika Bhat, Sara Wylie, Sung-Gheel (Gil) Jang, and EDGI
Acknowledgements
We thank Aparna Sundar, Casey Greenleaf, Chris Sellers, Cole Alder, Gabrielle Trudo, Gretchen Gehrke, Leif Fredrickson, Marianne Sullivan, and Paul St. Denis for their roles in reviewing this report and supporting the analysis.
Disclaimer
Data included herein were drawn from EPA’s publicly available Enforcement and Compliance History Online ECHO database on July 26, 2020. EDGI has no control over the nature, content, or sustained availability of this database. While EDGI works to assure that the information in this report is correct, that information is subject to limitations of the ECHO database, and is provided “as is.” EDGI makes no representations or warranties of any kind, express or implied, about the completeness or reliability of this information. The information and images within this report are for general information purposes only. To examine this data for yourself you can view our analysis here and re-run it here.
Key Findings
On March 26, 2020, the US Environmental Protection Agency (EPA) released a policy memo suspending pollution monitoring requirements for industries that claim to have been impacted by COVID-19. Since then, as part of EDGI’s ongoing Environmental Enforcement Watch (EEW) project, we have conducted original data science research using EPA’s Enforcement and Compliance History Online ECHO database to investigate the effects of this policy on facility reporting of environmental data and compliance with environmental protection laws.
Results show that although few facilities have claimed the COVID exemption, a significant proportion of facilities are still failing to report. This reflects longer-term trends in and issues with both industry non-compliance and EPA non-enforcement. We cannot afford a return to “normal”. Non-compliance with the nation’s environmental protection laws is already rampant – as high as 70% of facilities under some regulatory programs (Giles 2020).
Clean Air Act (CAA)
Monitoring: In March and April of 2020, facilities conducted 40% (~2,000) fewer tests of emissions from smokestacks, compared to the same months in 2019.
Violations: The number of reported “high priority” violations of the CAA has decreased. However, under the COVID memo, facilities are not required to report the environmental data that would indicate these violations. Almost 20% of the facilities with reported violations have been non-compliant with the CAA for the past three years and a third of facilities have spent at least half of that time in non-compliance. This substantial history of violating the CAA suggests that these facilities’ non-compliance is unrelated to the pandemic – yet, under EPA’s COVID policy, they may be excused from enforcement penalties.
Clean Water Act (CWA)
Missing and late reports: While only 325 facilities officially told EPA that due to COVID they could not submit the discharge monitoring reports (DMRs) typically required by the CWA, there were 50 times as many—16,550 facilities—that simply did not file DMRs or filed them late. Together, these facilities failed to file over 350,000 DMRs.
Violations: Not accounting for the decrease in monitoring and reporting, reported violations of the CWA are down by 20%, from around 25,000 in 2019 to 20,000 in 2020. As with the CAA, the vast majority of facilities exceeding their water pollution permits in March/April 2020 have been non-compliant with the CWA over the long term, with over 1,500 facilities out of compliance for each of the past 12 quarters.
Reporting Geography
Gaps in the reporting of environmental data do not necessarily follow patterns of closures due to COVID: reporting is down even in areas that did not shut down in March and April of 2020 due to COVID, including the oil/gas heartlands of Oklahoma and Texas.
Tracking EPA’s COVID-19 non-enforcement policy
COVID-19 is not just a public health crisis, it is a systemic environmental health and justice problem. Long-term exposure to air pollutants, many of which impact respiratory and cardiovascular health, has been suggested to correlate with worse outcomes from COVID, a virus spread through the respiratory system. Moreover, exposure to air pollutants is unevenly distributed across society; many studies confirm that Black and Hispanic communities bear a disproportionate burden of air pollution that is mainly produced by non-Hispanic whites. Racial minorities bear a larger burden from the US’s toxic fossil fuel economy and reap significantly fewer of its material rewards. Likewise, data from areas where race-based data is reported show that COVID cases, morbidity, and mortality are unevenly distributed. For instance, the age-adjusted death rate from COVID-19 for Black Americans is 3.7 times higher than for Whites.
Despite the connections between air pollution, respiratory illnesses and COVID susceptibility and mortality, the US Environmental Protection Agency (EPA)—the federal agency most responsible for ensuring our collective environmental health—suspended pollution-related reporting and enforcement amidst the outbreak this March. The EPA oversees several Congressionally-mandated programs established in the 1970s—including the Clean Air Act and the Clean Water Act—that aim to minimize or prevent pollution; the Clean Water Act (1972) even called for eliminating water pollution by the mid-80s. In practice, a key way EPA regulates the release of hazards into our air and water today is by issuing permits to facilities to emit pollutants up to a certain level. If facilities are found—through inspections or self-reporting—to have violated the conditions of those permits, they are deemed non-compliant and may have enforcement actions (e.g. monetary penalties) levied against them. EPA’s enforcement activities are largely built around permitting a specified level of emissions, asking industry to measure or estimate and report those releases itself, and then penalizing entities when they report exceeding established levels. However, the EPA’s willingness to step in and enforce permit conditions has declined over the past 15 years—and even more so under the Trump administration—as evidenced by our own analysis of EPA data and the agency’s Inspector General.
At the outset of an unprecedented public health crisis—when revitalized enforcement was needed the most—the EPA abdicated its responsibility after industry lobbying. On March 20, 2020, the American Petroleum Institute President Michael J. Summers wrote a letter to President Trump requesting leniency in “non-essential” compliance obligations, including routine testing and reporting to the EPA. Six days later, EPA released a policy memo detailing an unprecedented series of changes and exemptions to how regulated facilities would need to follow environmental laws during the pandemic and how the agency would enforce them.
EDGI annotated this memo in a previous blog post. In the memo, EPA wrote that it would not penalize industry for failing to monitor and report their pollution if “EPA agrees that such noncompliance was caused by the COVID-19 pandemic.” According to the EPA, industries may not be able to comply with monitoring and pollution-control requirements if it means unsafe workplace practices and putting workers at risk, and that as a result, “these consequences may affect the ability of an operation to meet enforceable limitations on air emissions and water discharges…” However, it is unclear why industries would still be operating at all if they didn’t have the capacity to comply with essential, public health-protecting environmental laws. As a former EPA attorney observed, “If everyone’s at work refining oil and making chemicals, and it’s just your compliance staff that’s been coronavirused-out, then they [companies] will need to explain that.” EPA denies its memo gives a blanket pass to regulated industries.
Our report provides a first review of the memo’s outcomes on industry reporting as reflected in publicly-available environmental data:
- How does the period from March 1–April 30, 2020 compare to previous years in terms of the number of permit violations and monitoring requirements missed?
- Are facilities polluting more or less?
- Are they still reporting?
- Where are non-reporting facilities?
We used EPA’s enforcement and compliance database, Enforcement and Compliance History Online (ECHO), to answer these questions and evaluate the EPA policy’s effects. Susan Bodine, Assistant Administrator of EPA’s Office of Enforcement and Compliance Assurance, has said that “the policy did not appear to be widely used by industry.” We find that there is some merit to Bodine’s claim, as relatively few entities regulated under the Clean Water Act have officially indicated to the EPA that they could not submit reports because of COVID. However, Bodine also stated that “given the continued submission of [water pollution] discharge monitoring reports, it appears that COVID-19 has not had a significant impact on routine compliance monitoring and reporting.” We find that this is not true, based on data reported in ECHO. Routine monitoring and reporting has significantly decreased compared to previous years.
Because the majority of emissions data is self-reported by industry, without reporting we cannot know what is being released into our collective air and water. The data shows that industry has taken advantage—if not formally—of EPA’s COVID policy. EPA has stated that it will wind down the policy by August 31st, even as another wave of COVID cases surges across the country. We present an initial analysis of what the policy has allowed thus far.
Making use of EPA’s ECHO database
Our investigation relies upon data from ECHO, the primary open data portal supplied by the EPA. ECHO integrates data from across EPA programs to allow users a view of (non)-compliance with US environmental law, usually by individual facility but sometimes aggregated by geography (e.g. statewide or region-wide trends). The data largely reflect industry’s own reporting of emissions or state-level agencies’ indication of violations rather than the EPA’s own assessment of pollutant releases. Given that the EPA has ultimate responsibility for regulating millions of entities across several environmental statutes all over the United States, and the fact that state-level environmental protection agencies also submit their own records of inspections, enforcement actions, and so on, the database is fragmented (data quality varies by environmental statute and by state), partial (there are no health data), and not necessarily easy to work with. For instance, to track enforcement and compliance across a specific company (say, Exxon), you would have to know each of the facility IDs for the company’s plants, a burden even for industry but more so for vigilant publics.
We describe in detail more of ECHO’s limitations below, but for now, note that as of this writing (July 29, 2020) we can only confirm results for March and April 2020. This is because of the timeline facilities and state-level agencies have for reporting to ECHO. Under the CWA, facilities are given 40 days to submit late reports before they are deemed non-compliant. Although the COVID policy memo was released late in March, the end of many facilities’ monitoring periods is the end of each month; for this reason we include all of March in our analysis. In addition, our analysis comparing March/April 2020 to previous March/Aprils is limited to 2001 and later, since EPA cautions that while data may be available from before this time period, it is of suspect quality. While the website interface allows the public to see trends over the past 3-5 years, we accessed the full datasets going back to 2001 for our analysis. We copied this data on a weekly basis to a server created by Stony Brook University’s Geospatial Center and Teaching and Learning Lab.
The ECHO data that we have been collecting and analyzing to answer questions about EPA enforcement during COVID are part of EDGI’s ongoing project called Environmental Enforcement Watch (EEW). We are coordinating a series of workshops that use ECHO data to address community-based and nation-wide questions about environmental enforcement. EEW looks at whether ECHO data can answer these questions and how other forms of knowledge like storytelling, data visualization, and research can provide more context to this data.
Here and in EEW, we analyze EPA’s ECHO data through the use of Jupyter Notebooks hosted on Google’s Colab platform. Jupyter Notebooks are interactive scripts of computer code written in programming languages such as Python and R but contextualized with blocks of non-code text. They are an emerging tool in data science, enabling researchers to document, share, and reproduce their analysis. They hold potential to open up the “black box” of big data. They allow us to contextualize as we research—rather than dumping data and results, creating a narrative to guide the reader through analysis, results, and limitations. Notebook users don’t need to be able to read code, but they do have the opportunity to engage with it. You can run the notebook we created specifically for this analysis here, or just view the full results here.
If you’re curious to focus on what’s going on in your neighborhood, community, or city, we encourage you to use the interactive maps in the report to see what facilities around you reported violations or failed to report environmental data. We also encourage you to reach out to us if you’d like to work more closely to better understand environmental pollution, enforcement, and compliance trends in the places that matter most to you! Below, we extract some of the most salient nationwide findings.
Fewer facilities are violating their permits….
We found that reported violations of both Clean Air Act (CAA) and Clean Water Act (CWA) permits are down during March and April 2020 relative to the same months in prior years. On the face of it, this seems to reflect ambient monitoring of air quality showing up to 15% decreases of criteria pollutants like ozone. Fewer facilities are operating, or they are operating at reduced capacity, so there are fewer violations. We will question whether this is actually true later. It is also important to note that even if we see pollutant levels decrease on a large scale, these numbers are not necessarily representative of localized pollutants that affect human health.
Looking at the CAA data, we see that reported “high priority” violations are down in March and April of this year compared to the same months in previous years (Figure 1). The long-term, 20-year trend also sees a decrease in reported violations of the CAA, which may be in part due to tightening standards (as industry argues) but could also be attributed to a decline in the government inspections that often reveal these violations in the first place (see Figure 6 below).
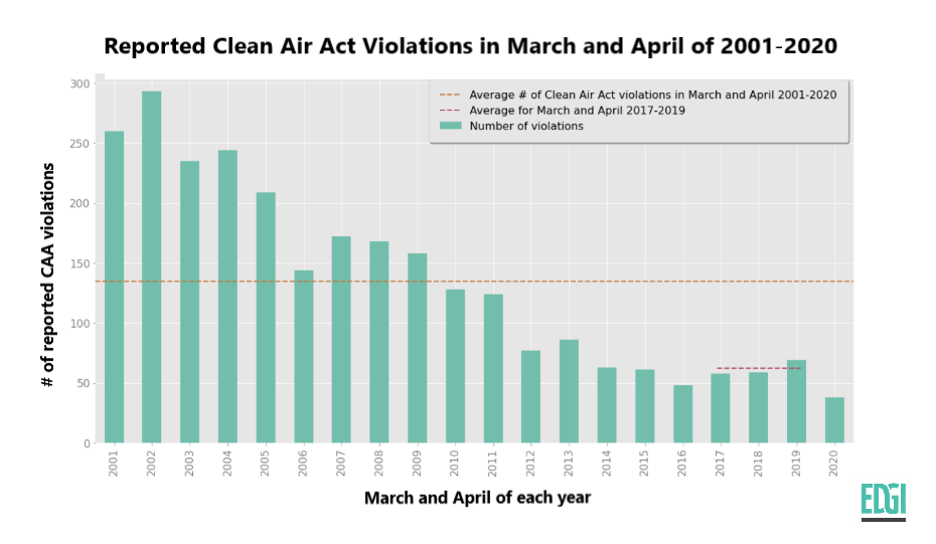
Figure 1. Reported high priority violations of the Clean Air Act for each March and April from 2001 through 2020.
Many of the 38 facilities that reported high priority violations of their CAA permits in March and April 2020 have consistently violated their CAA permits in the past. As shown in Figure 2, seven of these facilities have been out of compliance with the CAA for 12 of the last 12 quarters; i.e. they have been out of compliance for the last 3 years (see the far right column). Additionally, 13 facilities have spent half of that time period in non-compliance. Thus, the facilities where EPA enforcement is most desperately needed—those that habitually flout environmental laws—may, because of EPA’s COVID policy, be getting a free pass.
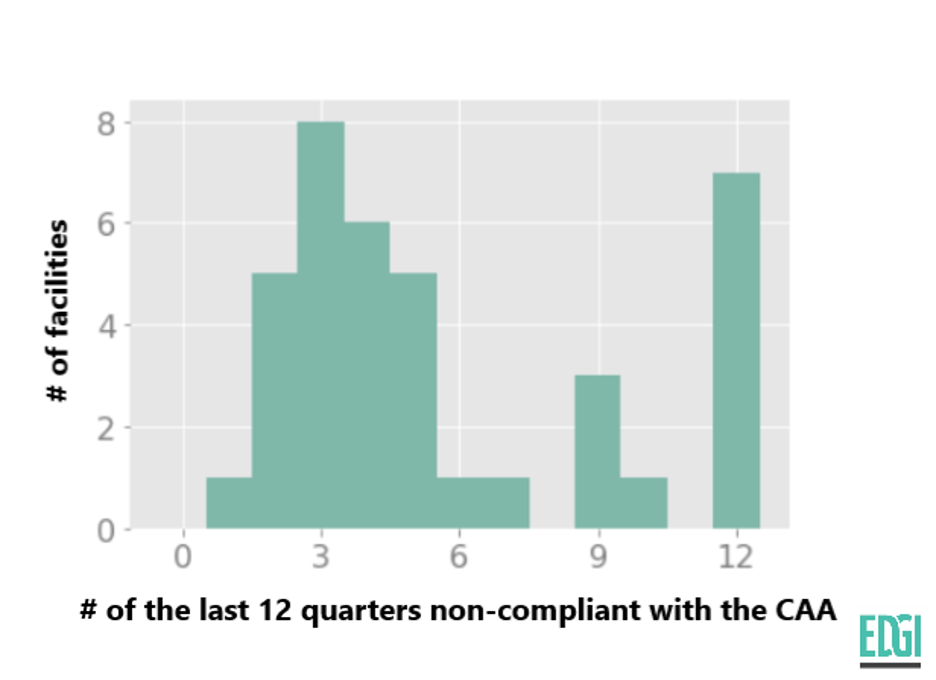
Figure 2. Facilities with reported high priority violations of the Clean Air Act in March and April 2020 and how many of the previous 12 quarters they were also non-compliant with the Clean Air Act.
Reported violations of the Clean Water Act are down from last year as well, by 20%, from approximately 25,000 to 20,000. We examined “effluent violations”, in which facilities self-report having released more pollutants into the water than their permits allow. The number of water pollution permits that were reported to be exceeded in March/April of 2020 was more or less the long-term average of 20,000 (orange line), but a significant drop from recent years (red line) (Figure 3).
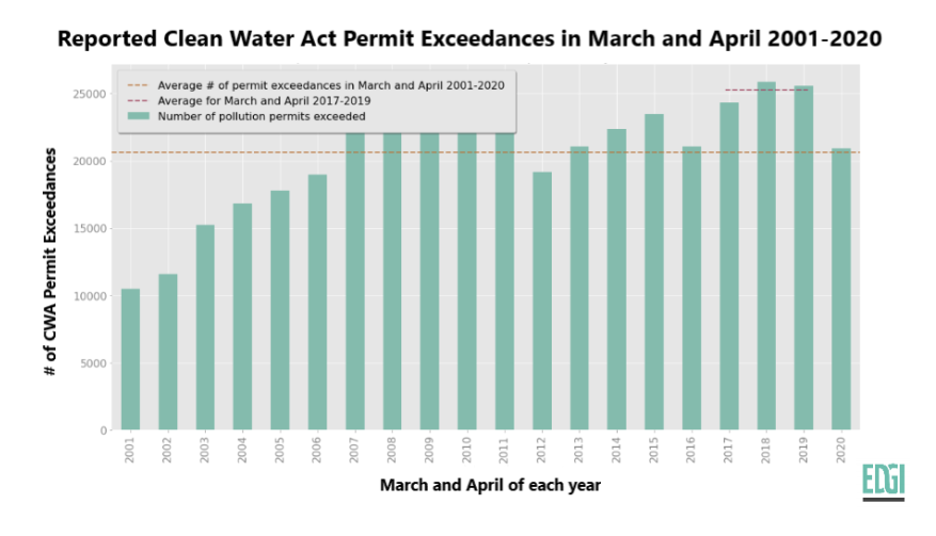
Figure 3. Reported “effluent violations” of the Clean Water Act.
Even more so than the CAA, the vast majority of facilities exceeding their CWA permits in March/April 2020 have been non-compliant over the long term, with over 1,500 facilities out of compliance with the CWA for the past 12 quarters, or since early 2017 (Figure 4).
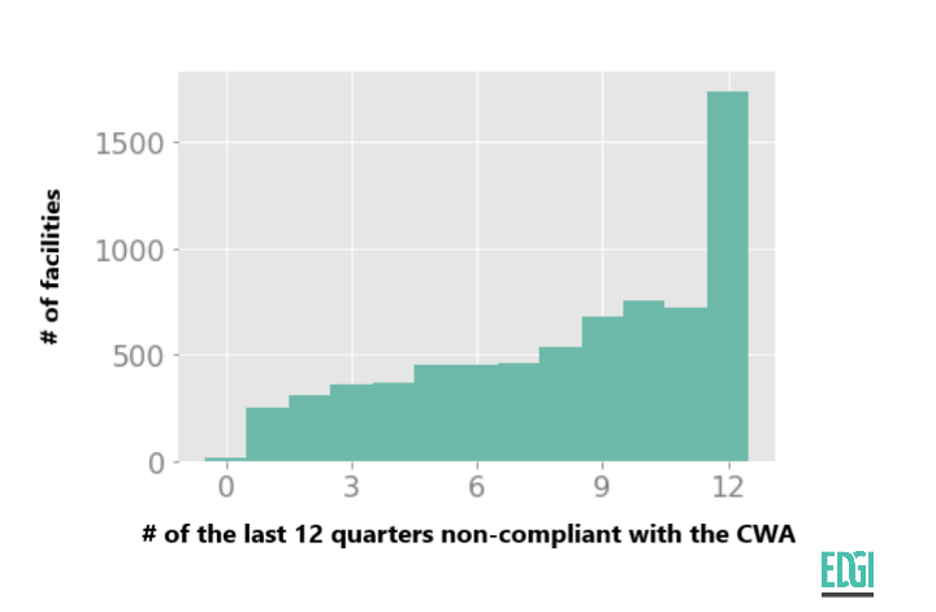
Figure 4. Facilities reporting effluent violations of the Clean Water Act in March/April 2020 and how many of the previous 12 quarters they were also non-compliant with the Clean Water Act.
….but monitoring, inspections and reporting are down too.
These seemingly large reductions in reported violations cannot be taken as proof of either reduced pollution or actual violations. Violations are likely undercounted because fewer facilities are reporting and conducting testing as normally required, and EPA and its state-level counterparts are inspecting fewer facilities. The determination that a facility has violated its permit is often made with self-reported numbers. Therefore, we cannot actually say that pollution is down relative to previous March/Aprils. We simply cannot know because facilities are not reporting environmental data and environmental agencies are not inspecting.
Under the Clean Air Act, facilities are sometimes required to perform and report tests of air emissions from their smokestacks. These periodic “stack tests” are required if a facility does not already continuously monitor its emissions or provide some other means to demonstrate its compliance with pollution standards. According to the EPA, this is “often the case” for particulate matter, which is linked to aggravated asthma, decreased lung function, and increased respiratory distress (EPA 2019: 1,2). Facilities required to conduct stack tests are typically larger facilities that emit over 100 tons of air pollutants annually. EPA states that “thorough and accurate stack tests are critical to prevent excess emissions from major sources from negatively impacting the health and well-being of nearby communities” (EPA 2019: 2). Studies have shown that facilities may go up to five years without conducting these tests (see Giles 2020).
Stack tests for March/April 2020 are well below the long-term average. Stack testing reached a peak in 2016, and though 2017-2019 saw a steady decline, the average for those years remained higher than the 20-year average. But the stack tests for March/April 2020 are even further below the average for the last three springs (Figure 5).
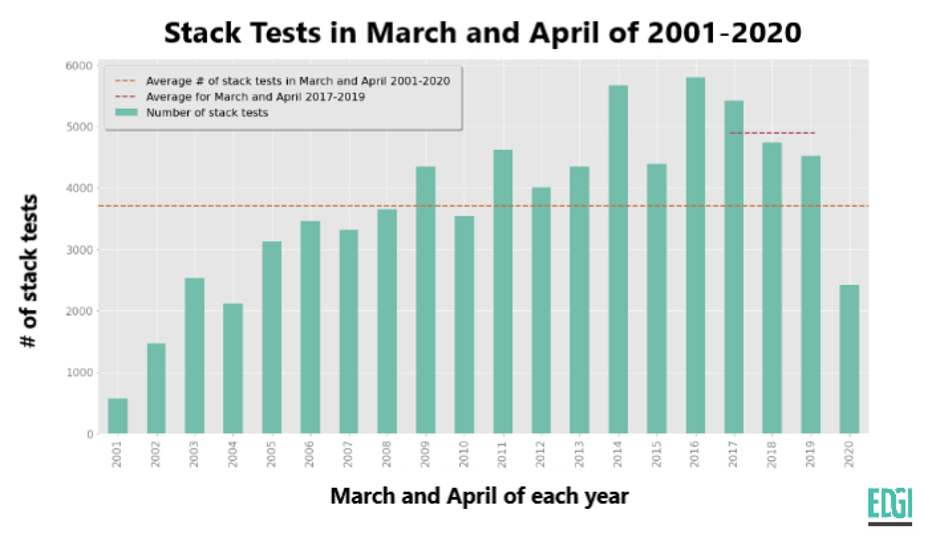
Figure 5. Facility tests of air emissions from their smokestacks.
While a facility may conduct its own stack test and report the results, facilities are also supposed to be inspected from time to time by environmental regulators. These are mostly led by state-level agencies, such as the Texas Commission on Environmental Quality (the second largest environmental agency in the world). Inspections dropped precipitously starting in 2017. In 2020, because of social distancing policies practiced by environmental agencies themselves, as well as exemptions similar to EPA’s that state agencies have enacted, inspections to ensure compliance with Clean Air Act permits have further plummeted (Figure 6). This would be alarming even in “normal” times, but is even more concerning during a pandemic of a respiratory virus.
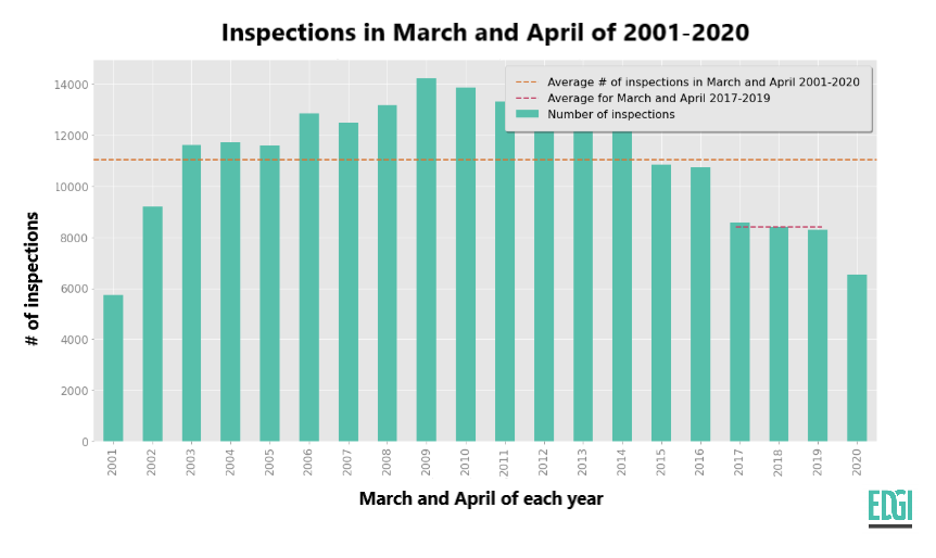
Figure 6. Inspections of facilities to evaluate compliance with the Clean Air Act. These are typically done by state-level agencies, rather than the US EPA itself.
Under the conditions of their Clean Water Act permits, facilities are required to submit a variety of reports to EPA: a factory might submit Status/Progress reports and Annual Inspection Certifications, a city government may need to share its Municipal Separate Storm Sewer System program report, and a Concentrated Animal Feeding Operation (CAFO) would deliver annual reports. In March and April of 2020, more than 1,600 of these reports were not filed or filed late, automatically generating non-compliance status for these facilities. While 2018 and 2019 also had a significant amount of violations caused by failures to submit these reports, there was an additional 25% increase in these violations in March/April 2020 (Figure 7).
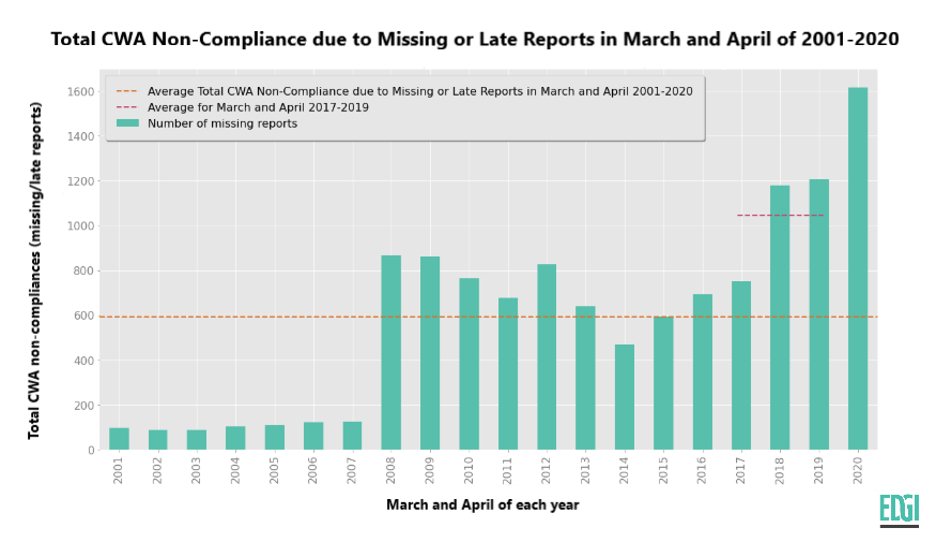
Figure 7. Total non-compliance with the Clean Water Act due to facilities failing to submit annual reports, inspection certifications, and CAFO reports, among other types of required information.
A disproportionate number of the facilities that failed to submit these scheduled reports are located in Washington state, New York, and New Jersey, all of which shut down earlier than the rest of the country. But many facilities in Missouri, the Chicagoland area, and the oil/gas heartlands of Oklahoma and Texas also failed to submit reports.
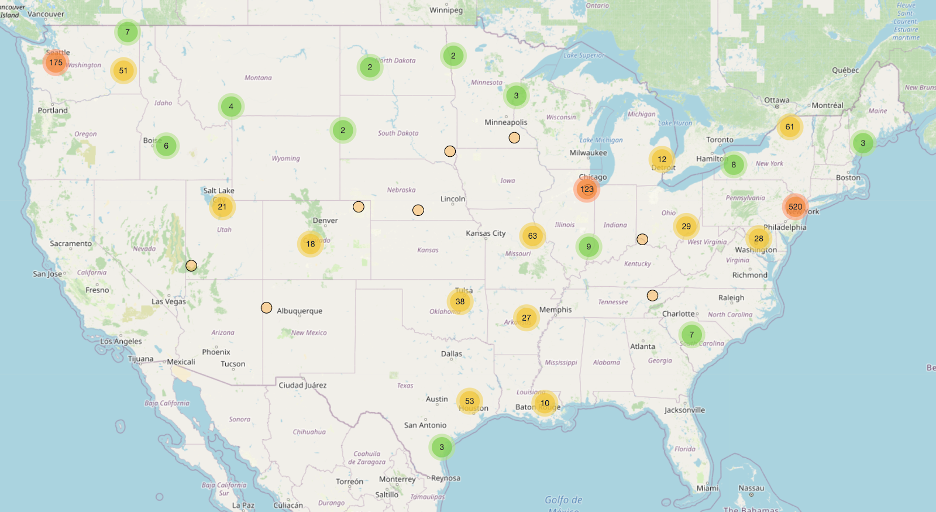
Figure 8. Facilities that failed to submit annual reports, inspection certifications, status updates, and other documentation required of their Clean Water Act permits.
Facilities are also required under the CWA to submit Discharge Monitoring Reports (DMRs) to EPA, often on a monthly basis. These show the agency how much of each permitted pollutant the facility is releasing into our waters, and EPA’s algorithms assess whether that amount is in line with or above the allowed threshold. There were over 350,000 missing or late Discharge Monitoring Reports (DMRs) on water pollution in March/April of 2020 (Figure 9), from over 16,000 facilities (Figure 10). While not an all-time record, it is above two of the previous three March/April periods, as well as the long-term average for those months, and is the fourth highest amount over the past 20 years.
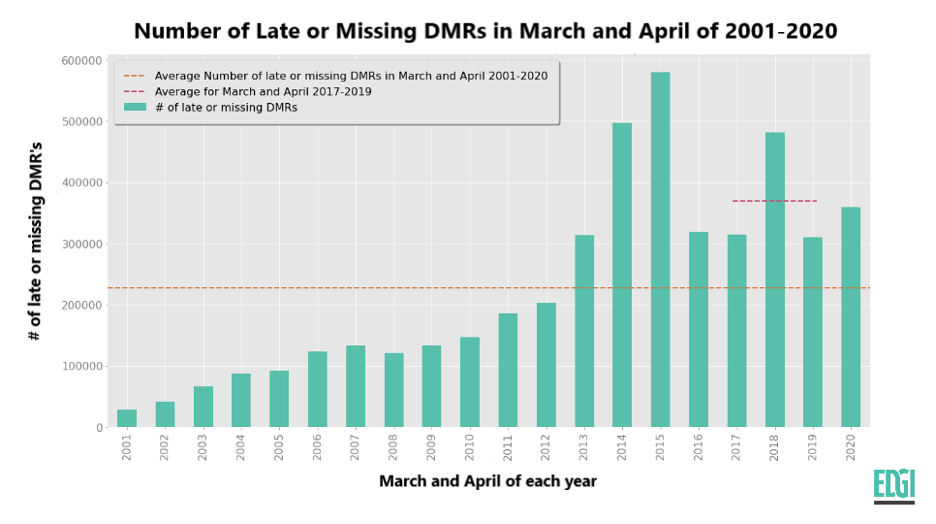
Figure 9. Number of missing or late discharge monitoring reports required under the Clean Water Act.
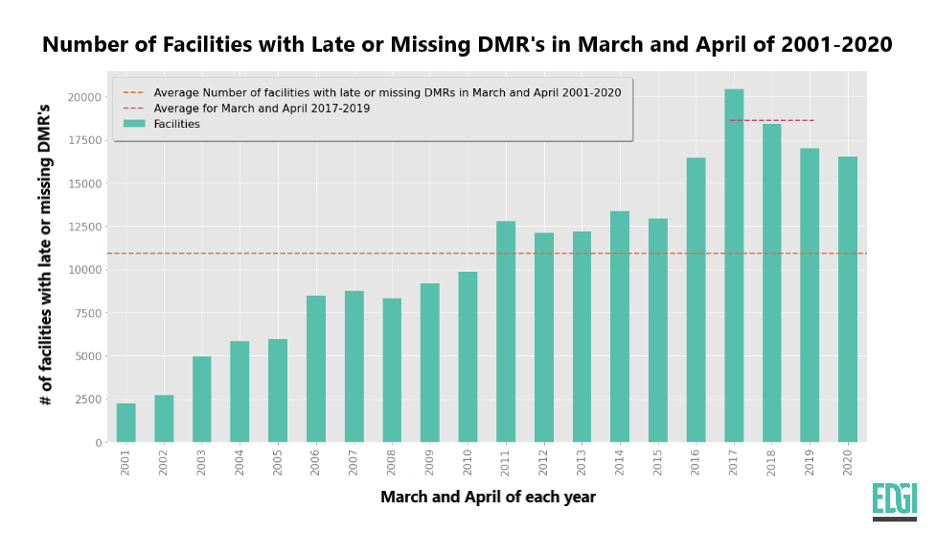
Figure 10. Number of facilities not submitting or late to submit discharge monitoring reports required under the Clean Water Act.
Only 325 of these facilities officially indicated to the EPA that they were unable to provide discharge monitoring reports due to COVID-19. Susan Parker Bodine, the director of EPA’s enforcement and compliance office, has said that this is only a very small fraction of all facilities permitted by the EPA (“six tenths of one percent”).1 However, Bodine’s comments leave out much. There were 50 times as many—16,550 facilities—that simply did not file DMRs or filed them late. These facilities missed a total of more than 350,000 reports. In other words, while only a fraction of all CWA-regulated facilities officially took advantage of EPA’s leniency, there were still thousands of “extra” missing pollution reports that facilities didn’t file. It may be that facilities will file them in the coming months, but this extreme flexibility is yet another indication of how environmental protection and data rules favor industry over the public. For instance, when industry submits a request for EPA to review the health safety of new chemicals, the agency has only 90 days to respond. Surely, if EPA can be expected to make a proper determination about chemical safety in that timeframe, we can demand industry be prompt in its own reporting.
Environmental data justice: Data science can’t tell us everything.
“We have no data to support the premise that there is a correlation between facilities encountering difficulty in reporting due to the COVID-19 public health emergency and an increase in discharges from those facilities”
EPA spokesperson, July 10 2020, to The Hill
Again, the absence of data should not be taken as the absence of pollution. When EPA says it cannot connect facilities’ reporting challenges to an increase in pollution that is because data to prove those connections is largely absent. It is absent in part because of EPA’s decision not to enforce monitoring and reporting requirements during COVID. Data on pollutants that are hazardous to the respiratory and immune systems are even more vital at this time to ensure sound epidemiological science and environmental justice. If a facility isn’t reporting, we can’t know how many toxics and other harmful chemicals it is releasing into the air we breathe and the water we drink.
Although EPA’s ECHO data is fragmented and partial, it remains the public’s most important source for tracking facilities’ compliance with U.S. environmental law. In line with the principles of environmental data justice that EDGI has put forward, and what D’Ignazio and Klein call “data feminism”, we want to highlight the broader context surrounding the ECHO database—not just technical issues (figure 11) and also not just the problems with EPA’s decision to waive data reporting requirements. Even in “normal” times these regulatory data systems—and their gaps—are designed largely to the benefit of industry. While ECHO attempts to make what data exists much more widely accessible— a highly laudable goal—it is nevertheless a product of a permission-to-pollute system that accepts public health harm and trusts industry to self-report.
Even though in aggregate—across the entire country or even across a region—pollution levels may have decreased in the early months of the COVID pandemic (this is debatable), we know that exposures are spatially-specific and are disproportionately located in low-income communities of color. According to the NAACP and the Clean Air Task Force:
- “African-Americans are 75 percent more likely than others to live near facilities that produce hazardous waste”
- “More than 6.7 million African Americans live in the 91 counties with oil refineries”
- “African Americans are exposed to 38 percent more polluted air than Caucasian Americans” (NAACP and CAFT 2017 p. 6,3,6)
Because of industry non-reporting and the fact that routine, real-time reporting is not required to begin with for Clean Air Act-regulated facilities, we have little idea what effect specific facilities, in specific neighborhoods, are having on the people and environments most directly exposed. Ambient, region-wide conditions may have improved, but conditions around specific facilities may not have. The fragmentation of the US’s environmental data infrastructure is thus an environmental justice issue.
EPA does detail the known data problems with ECHO, many of which boil down to the fact that it is up to the states to submit data to EPA, but each does so in different ways (e.g. continuous vs batch processing), making standardization and comparison challenging. This is similarly a problem with public health data reporting—statistics on COVID cases are collected at the local level and the CDC has no authority to force local agencies to collect certain kinds of information. The known problems with ECHO data actually appear to be more prevalent in the Clean Water Act’s automated and regular reporting system than in the CAA, where less frequent stack tests and inspections are the norm. At least eight states have indicated that their systems may be incorrectly flagging facilities as non-compliant with the CWA. For instance, while Missouri appears to have a disproportionate number of facilities that failed to submit basic reports this spring (figure 8), this may be an artefact of an already known data issue, requiring the vigilant public to go to the trouble of contacting the Missouri Department of Natural Resources to verify. The relatively recent, more advanced reporting system for the Clean Water Act brings with it its own problems, instead of being a solution.
Additionally, ECHO is not set up to link pollution data to health outcomes. Our analysis has centered on the data that is most easily accessible, but this approach is limited because it only tells us about those facilities that polluted beyond their permitted levels—not the actual emissions or discharges of all reporting facilities.2 Fundamentally, permits are permission to pollute; even when a facility stays within its permitted level of emissions, the facility may still be releasing toxic chemicals and particulates into the environment, contributing to the conditions that increase COVID-19 susceptibility, disease severity and death rates.
EPA plans to suspend its non-enforcement policy by the end of August. New data on permit violations and non-reporting for the months of May and June will come in by then. We expect to observe the same patterns: some facilities will continue to routinely exceed their permits, and most of these will experience no enforcement to back up the environmental laws (EPA’s status quo across the last several years). More facilities will likely fail to report environmental data, but not bother to flag this as COVID-related. And the vast majority of facilities will toe their legal limits, emitting pollutants into communities with the permission of the EPA.
Many facilities appear to have understood EPA’s COVID policy as a free pass to forgo the requirement to self-report on their emissions. But when it comes to an end, we cannot afford a return to “normal.” Non-compliance with the nation’s environmental protection laws is already rampant. Cynthia Giles, former director of EPA’s Office of Enforcement and Compliance Assurance under Obama, has estimated that for some programs, non-compliance may be as high as 70% of all facilities. For programs like the Clean Water Act, where reporting is more direct and data infrastructures are more integrated, it is still the case that a quarter of all facilities are regularly in significant non-compliance. In effect, facilities are not only explicitly permitted to pollute, they are given implicit permission to exceed their permits. As the COVID policy has only made more evident, what we need is a robust overhaul of the permission-to-pollute approach and the fragmented data infrastructures that prop it up.
Notes
1 Bodine actually points to 352 facilities but, unlike us, may be looking at March, April, and May. This number has also grown over time. When we originally ran our analysis in late June 2020 it was 294. Now it is 325. Months after the fact, more facilities are telling EPA they were late to submit crucial environmental data because of COVID.
2 This is more true for the CAA than for the CWA; there are other datasets that offer a more complete view of reported water pollution, but these files are separated by fiscal year and not easy to work with.