
Authored by EDGI’s Website Monitoring Team
Welcome! This post is part of the EDGI Website Monitoring Team’s “Change of the Week” blog series. The purpose of this series is to highlight interesting changes we have observed in the language used on, or access to, federal websites. We want to share these changes to encourage public engagement with and discussion of their significance, as well as understanding of the ephemeral nature of website information. This week’s change was made in 2017 and features the subtle removal of the lead-in sentence about methane from the EPA’s Overview of Greenhouse Gases page.
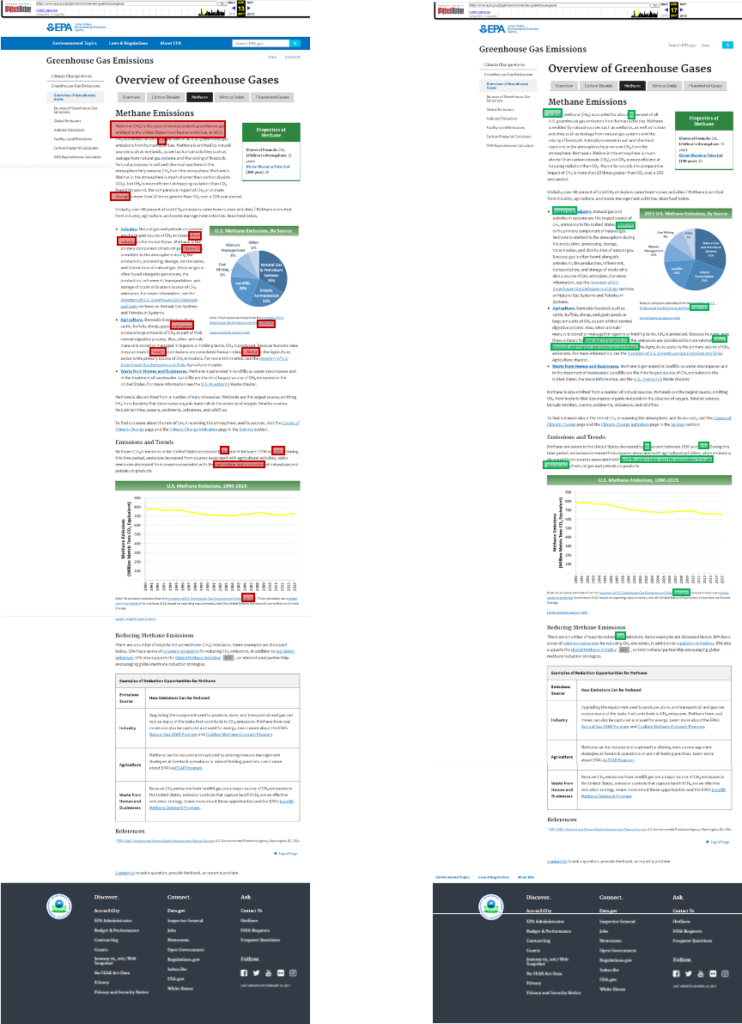
Text highlighted in red was removed; text highlighted in green was added. These changes were made between April 13, 2017 and April 17, 2017.
What happened? In mid-April, 2017, the introductory sentence under the “Methane” tab, “Methane (CH4) is the second most prevalent greenhouse gas emitted in the United States from human activities,” was removed from EPA’s “Overview of Greenhouse Gases” page. Additionally, a graph of annual methane emissions was updated to include new and revised past data.
Why we think this is interesting: Methane is a powerful greenhouse gas; its global warming potential over 100 years is 25 times that of an equivalent amount of carbon dioxide. During the last decade, methane emissions have come center-stage when addressing climate change mitigation, and, in addition to voluntary measures adopted by industries, EPA and DOI both promulgated rules in 2016 regulating methane emissions by the oil and gas industry. However, DOI “revised” its Methane and Waste Reduction Rule in 2018, severely hampering its effectiveness. Just this month, EPA also formally rolled back its methane rule by rescinding the 2016 new source performance standard, though it is expected that lawsuits will be filed quickly. Even the oil and gas industry has been opposed to EPA’s rollback, and this week 87 members of the House of Representatives called for the withdrawal of the rescission.
For this week’s “Change of the Week,” we looked back at the earliest website changes that we’d found regarding methane. This was one of the first under the Trump administration, and it’s a subtle change. Just one sentence was removed, but it is an important sentence that was the lead-in on this page. Reading that methane is the second most prevalent greenhouse gas emitted in the U.S. from human activities provides perspective on the critical nature of the issue, including its source. With this change, the reader loses valuable context, and when reading that methane accounts for 10% of the U.S. greenhouse gas emissions [in the current first sentence] might think, “what are the bigger fish to fry?”
The other change to note here is in the “U.S. Methane Emissions” graph under the “Emissions and Trends” heading. The underlying data in the April 13th graph comes from EPA’s “U.S. Greenhouse Gas Inventory Report: 1990-2014” (though the link text reads “Inventory of U.S. Greenhouse Gas Emissions and Sinks: 1990-2014”) whereas the April 17th graph comes from EPA’s “Inventory of U.S. Greenhouse Gas Emissions and Sinks: 1990-2015.” We did not read these sources to examine their methodology or find out why the data might be different, but want to point out that the data displayed in the two graphs appear to diverge starting around the year 2000, and there is a notably different trend presented in the two graphs. The April 13th version of the page indicates that there had been a 6% decrease in methane emissions from 1990 to 2014, and shows emissions ranging from 700-740 million metric tons since 2000. In contrast, the April 17th version shows a 16% decrease from 1990 to 2015 and a gradual decrease from 700 to 660 million metric tons since 2000. We mention this website change to highlight that data and graphs are often received as canonical, when in reality there are many factors shaping the data presented.