
By: Eric Nost, Megan Raisle, Kelsey Breseman, Steve Hansen, Lourdes Vera, Sara Wylie, and EDGI
EDGI’s Environmental Enforcement Watch project (EEW) works to surface publicly available, if not accessible, information on the hundreds of thousands of places that report pollution to the US Environmental Protection Agency (EPA) and its state-level counterparts. EEW has collaborated with partner organizations and civic scientists to collectively make sense of this data, analyze it at meaningful geographic units like watersheds, and to offer recommendations for reworking federal environmental data infrastructure. In this post, we introduce EEW’s new open-source Jupyter Notebook for analyzing greenhouse gasses (GHGs) by the entities that either supply or emit them. This tool contributes to a reframing of accountability for climate change in terms of fossil fuel capitalism.
In Brief
- We developed a data science tool to show which companies are responsible for the most GHG emissions, across the country and by state.
- We describe the rationale behind the tool. In brief, we hope it contributes to a reframing of accountability for climate change in terms of fossil fuel capitalism. Instead of summarizing GHGs solely in terms of countries, states and provinces, or cities, carbon footprints should also be quantified by company and regulated as such.
- We share preliminary findings, including:
- Just ten companies account for over 20% of all direct emissions of GHGs from power plants and similar sources.
- In contrast, just ten companies account for over 50% of all emissions from supplier sources such as petroleum refineries.
- For example, the emissions generated from the petroleum company Marathon’s products are equivalent to the power requirements for over 70,000,000 homes.
- We invite educators, journalists, and civic organizations to explore the tool and find the biggest emitters for each state. We welcome everyone to reach out to us to arrange workshops where we can analyze the data together.
Owning Up
The lack of accountable action on climate change at last year’s Conference of the Parties (COP) meeting in Glasgow highlights the importance of naming the climate crisis’s roots: fossil fuel capitalism.
In meetings like last year’s COP, GHG emissions and reduction targets are usually measured for individual nation-states. For instance, under the Paris Agreement, the US reported emitting about 6.5 million metric tons of carbon dioxide equivalent (tCO2e) in 2005 and pledged to cut that in half by 2030. This approach makes some sense, since national legislatures and bureaucracies can set and enforce strong policies around climate.
But this approach obscures which entities within a country are more or less responsible for GHG emissions; in particular, it overlooks the carbon footprint of sub-national and multinational corporations (militaries’ GHG emissions are also important to specify). Fossil fuel companies play powerful if sometimes subsurface roles in the climate crisis—they have: under-invested in renewable energy, restrained and delayed policies that support the growth of green energy, constructed and funded a movement denying the existence of climate change, invested individuals’ pension funds in fossil fuel infrastructure projects, and pitted regions against one another in competition for investments and tax revenue. None of these dynamics can be adequately recognized or regulated with a lens solely on “US,” “Canada,” or any other administrative unit.
Symptomatic of the political and cultural power of fossil fuel capitalism, dozens of calculators exist to measure individual consumers’ carbon footprints. Personal actions, however, will never meaningfully restrain GHG emissions when political, economic, and infrastructural investments in consumer capitalism require fossil fuels and petrochemicals. Matt Huber’s alternative to personal footprint calculators, for example, shows how insignificant individual emissions are in relation to industrial production processes.
The ability of consumers to “demand” greener options is, structurally, minimal. For most of the US, public transport is not an economically viable option for commuters; neither is access to non-fossil-fuel-derived electricity or home heating. Fossil fuels are baked into our infrastructure; consumer choices are too limited to produce systemic change on their own.
Instead, untangling these harmful patterns requires centering corporations in studies and policymaking. Meaningful accountability requires treating climate targets and emissions data differently. Instead of summarizing GHGs in terms of countries, states and provinces, or even cities, carbon footprints should be quantified by company and regulated as such.
Luckily, the data exist to bring corporate emissions into the center of policymaking. For instance, the Climate Accountability Institute (CAI) measures global GHG emissions in terms of state-owned and private corporations. They have found that just 20 companies account for a third of all carbon emissions since 1965.
To advance this work with a focus on emissions made in the US, we turned to EPA datasets. Our new tool shows carbon emissions summarized by the corporation that owns (or partially owns) the facilities where GHGs are supplied or directly emitted.
An Opportunity: EPA’s Greenhouse Gas Reporting Program
EPA’s data infrastructure is oriented around individual facilities: A facility is permitted to release toxicants into the air or water; it is required to report any release of those materials and may be inspected or fined from time to time. EPA usually does not track (or at least does not make public) any information about who owns these facilities. EPA records, for example, might include a facility named “Baton Rouge Plant” but not the important fact that it is owned by ExxonMobil.
However, for its Greenhouse Gas Reporting Program (GHGRP), EPA does collect ownership information. EPA doesn’t regulate GHG emissions in the same way it regulates lead or sulfur dioxide pollution. While the revived Clean Power Plan promises to compel states to reduce GHGs, EPA doesn’t permit facilities in this regard. Instead, it collects and publishes emissions estimates from a variety of sources through the GHGRP. There are no penalties, inspections, or lawsuits associated with the GHGRP, but it does provide the public with a lens into where carbon emissions are coming from. There are approximately 9,000 facilities currently reporting under the GHGRP.
There are some major limitations with EPA’s GHGRP data. For one, it doesn’t capture all of the US’s emissions. Specifically, it doesn’t capture emissions that aren’t reported to the EPA: from wildfires and land use change, from farms, from facilities with fewer than 25,000 tCO2e to report, and emissions that are determined to be confidential. The GHGRP also doesn’t directly measure emissions from end users like automobile drivers, though it does cover the fossil fuel suppliers like refineries and it requires them to estimate the emissions that occur when their product is combusted. It is important to note that these numbers are self-reported by industry to the EPA, and companies don’t have much incentive to get their numbers right. EPA says that, in the end, the GHGRP covers about 85-90% of the country’s emissions.
It’s also the case that full transparency in corporate carbon emissions simply isn’t possible, if only because owner names and structures can be unfamiliar. For instance, one of the largest emitters, as we’ll show below, is something called Enterprise Products Partners. As a “midstream” player in the oil/gas sector—they manage pipelines rather than sell you gas—most people probably haven’t heard of them.
Ownership structures may not fully account for emissions responsibility anyway. For instance, we might learn that a university’s power plants contribute some amount of emissions, but the GHGRP dataset doesn’t tell us anything about the university’s investments in polluting companies. Additional research is required to determine which companies the university endowment and pension plan hold stock in. Additionally, what’s reported to the GHGRP is each facility’s highest-level US-based parent company, so we are not capturing subsidiaries or shell companies, nor foreign ownership.
Finally, there are some technical challenges. Slight variations in the spelling of company names in EPA’s ownership records would mean emissions wouldn’t get summarized properly. We assume EPA has entered company names into their database in a standardized way, but this is unfortunately unlikely. There are also a couple hundred or so facilities in the dataset that reported zero emissions, so we highlight these and then remove them from further analysis.
What We Did
Recognizing that these limitations exist and theorizing why they exist (it is not necessarily in EPA’s or corporations’ best interest to have flawless data), we produced a data science tool that anyone can use to see which companies are responsible for the most emissions, across the country and by state.
Our tool starts by getting the GHGRP emissions data folder from EPA’s website. This folder has emissions data going back to the beginnings of the GHGRP in 2010. We focus on the most recently available information, from 2020.
We make a distinction between “direct emitters” and “suppliers” following how EPA breaks down facilities. Direct emitters are sources such as power plants and other facilities with smokestacks from which GHGs are released into the atmosphere. In other words, most direct emitters are “point sources” of emissions. Direct emitters also include “area-based sources” of emissions that cannot be traced back to a specific address; these include certain kinds of electrical equipment and onshore oil and gas production.
Suppliers, on the other hand, include petroleum storage facilities that do not directly release GHGs into the atmosphere, but which facilitate the movement of fossil fuels and other emissions-containing substances to end users like individual automobile drivers or, indeed, some direct emitters. We have to analyze suppliers and direct emitters separately in order to avoid double counting emissions.
After summarizing emissions for both direct emitter and supplier facilities, we load a separate file from EPA’s website that contains information about who has ownership stakes in those facilities. We join the two datasets, take the facility-level emissions data, and append it to the ownership table. Each row in the ownership table indicates a corporate owner with >0% share in the facility. So, each facility might take up several rows in this dataset. Here’s a totally made up example to illustrate:
| Facility | Emissions (tCO2e) | Owner | Stake (%) |
| Power Plant #25 | 100,000 | Berkshire Hathaway | 25 |
| Power Plant #25 | 100,000 | Koch Industries | 60 |
| Power Plant #25 | 100,000 | Alliant Energy | 15 |
| Broad St Refinery | 1,000,000 | BP America | 90 |
| Broad St Refinery | 1,000,000 | Koch Industries | 10 |
Next, we attribute emissions to each owner based on their ownership stake. Continuing with the previous example, we now have:
| Facility | Emissions (tCO2e) | Owner | Stake (%) | Emissions Responsibility (tCO2e) |
| Power Plant #25 | 100,000 | Berkshire Hathaway | 25 | 25,000 |
| Power Plant #25 | 100,000 | Koch Industries | 60 | 60,000 |
| Power Plant #25 | 100,000 | BP America | 15 | 15,000 |
| Broad St Refinery | 1,000,000 | BP America | 90 | 900,000 |
| Broad St Refinery | 1,000,000 | Koch Industries | 10 | 100,000 |
This allows us to aggregate emissions responsibility across facilities by owners, to arrive at something like this:
| Owners | Combined Emissions Responsibility (tCO2e) |
| Berkshire Hathaway | 25,000 |
| BP America | 915,000 |
| Koch Industries | 160,000 |
We do this separately for both direct emitters and suppliers.
At this point, the tool allows users to analyze the data in a number of ways. For instance, we can filter it to focus on companies’ emissions within a selected state. We can also search the results for interesting patterns, such as emissions from non-profit owners like municipalities (i.e. public utilities) and universities (i.e. campus power plants) using queries like “city of …” and “university.”
Some Notable Preliminary Findings
You can see a presentation of our preliminary findings here:
We found that the 10 biggest emitters, by individual facility, are nearly all power plants. This makes sense, as they are burning fossil fuels—probably coal—to generate electricity. The one facility in the top 10 that isn’t a power plant is an oil refinery, ExxonMobil’s Baytown, Texas, facility, which recently experienced a “major industrial accident” leading to several injuries.
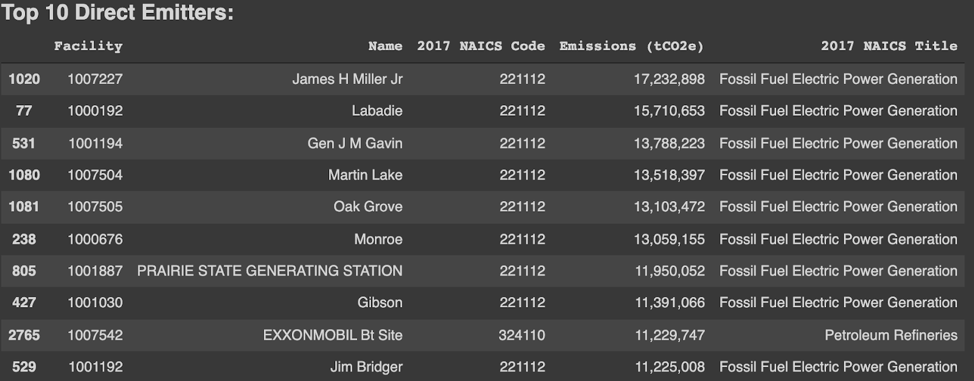
The largest direct emitter, the James H Miller Jr. coal-fired power plant in Alabama, generated over 17,000,000 metric tons of CO2 equivalent in 2020. That’s equal to the annual carbon emissions from over 3,500,000 passenger vehicles. According to the EPA’s GHG equivalencies calculator, it would require more than 280,000,000 trees growing for 10 years to sequester this amount of carbon.
Examining power plants in this manner gives us a sense of the emissions reductions possible with a switch to renewable energy sources. Our analysis shows that 56% of reported direct emissions of GHGs in the US in 2020 came from facilities that are primarily classified as “fossil fuel electric power generation.” Switching these facilities to renewable sources would drastically reduce carbon footprints. According to the EPA’s calculator, the emissions that could be avoided are equivalent to those avoided by approximately 300,000 wind turbines.
The 10 largest suppliers are mostly refineries. This too makes sense as they are producing the gasoline and diesel that is combusted in transit by airplanes, cars, trucks, and buses. Note that ExxonMobil’s Baytown site is both a significant direct emitter and supplier.
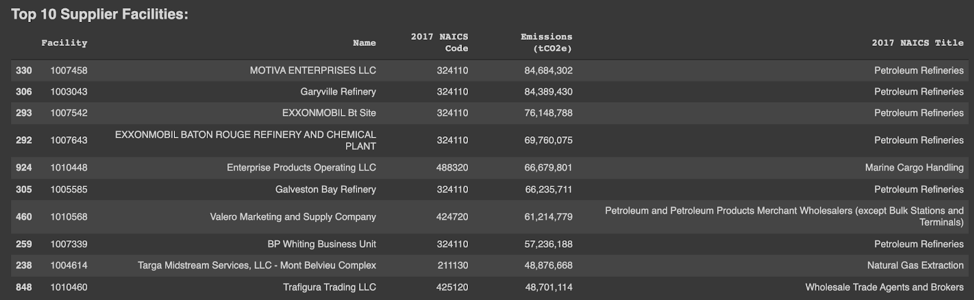
Motiva’s facility emitted the equivalent of emissions from 10 billion phone charges. We’d need to plant over 100,000,000 acres of forests to offset that. But instead of getting together with your friends and trying to reduce how often you charge your phone (you can’t possibly have enough friends), or planting an enormous amount of forest (you can’t possibly have enough land—the US government itself only owns ~650,000,000 acres), we could instead organize to force this one facility to reduce its emissions.
The Punchline: Emissions Analysis for Parent Companies
An even greater leverage point exists in looking at companies’ entire operations, not just single facilities. The largest direct emitters by company are, not unexpectedly, electrical utilities such as Xcel Energy and, for suppliers, oil/gas majors like Exxon Mobil, BP, and Chevron.
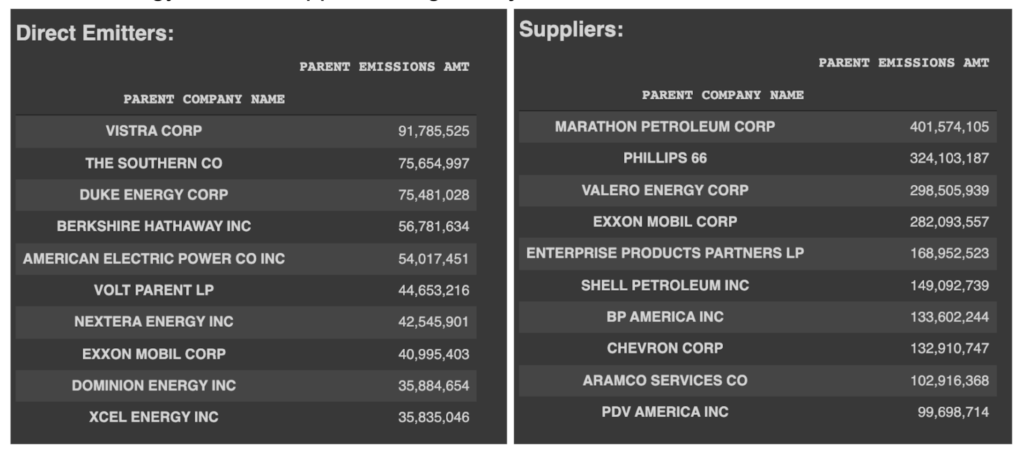
The petroleum company Marathon’s emissions—the most by far—add up to the power requirements for over 70,000,000 homes. Your household and 70,000,000 other homes could try to coordinate to manage our home energy consumption, or we could organize to apply pressure to Marathon and its 21 refineries.
The top ten companies listed here account for over 20% of all direct emissions of GHGs. The top 50 account for half of such emissions. In contrast, just the top ten owners of supplier facilities account for over half of all supplier emissions.
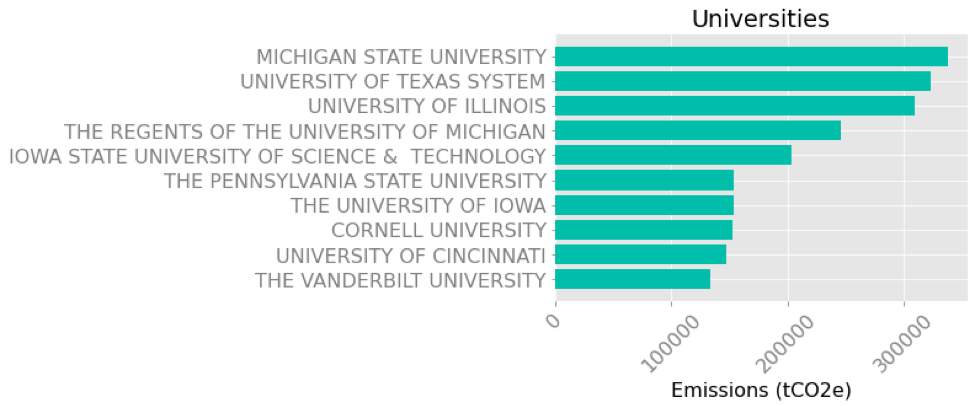
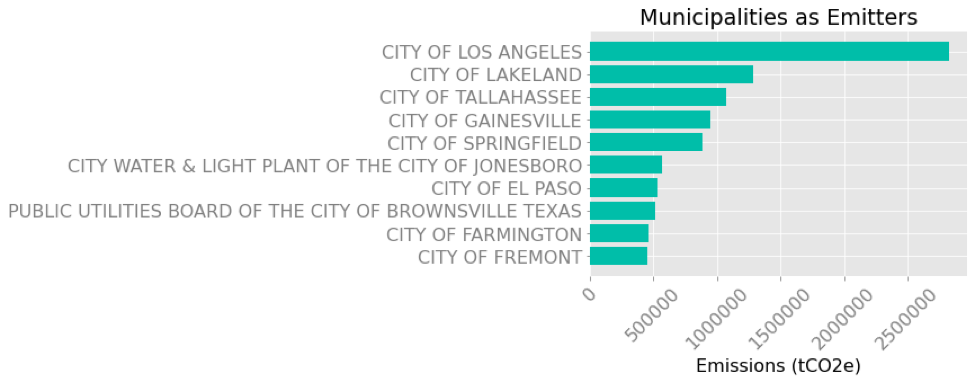
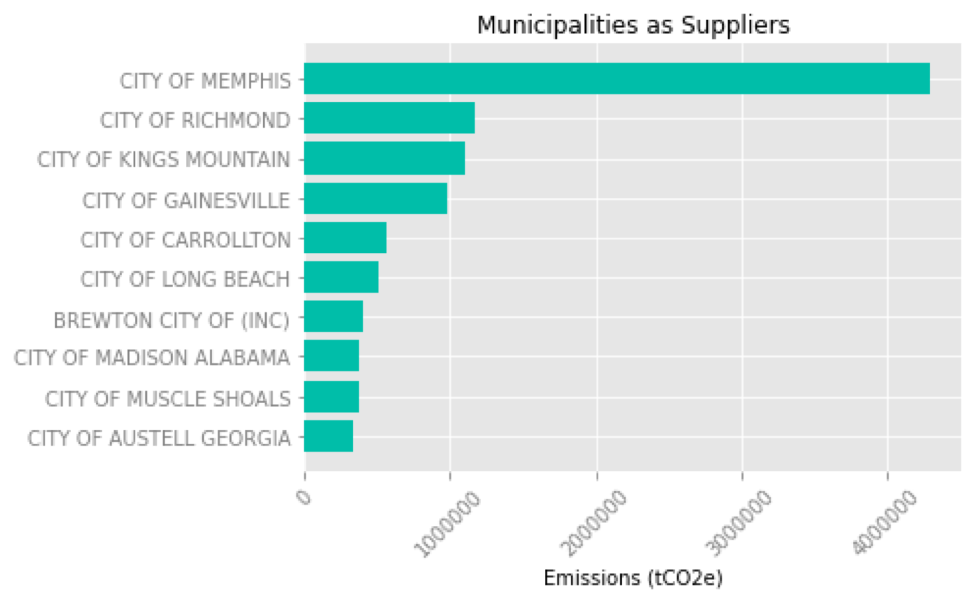
We also explored the data in terms of other kinds of owners, such as non-profits. By filtering the owners column to find names that include “City of” and “University” we examined how emissions stack up for these two kinds of public entities. Not every municipality is officially a “City of” and we are missing colleges when we search for “university” in owner names. The results we present below are a starting point.
Universities are minor polluters in the grand scheme of things. For instance, Michigan State is the largest emitter but only released 300,000 tCO2e in 2020, compared to Marathon’s 400 million. At least in this dataset, universities are mostly if not entirely directly emitting GHGs from campus power plants that are run in their name. What we are not seeing are emissions linked to universities’ investments in fossil fuel corporations.
Some cities across the country own their energy utilities, giving the public the chance to democratically shape climate futures. Indeed, fighting for public utilities is a central component of the climate struggle, with people in cities around the country demanding their energy providers shift away from coal power and gas heating. In our preliminary results, the City of Memphis stands out as the largest supplier of GHGs. We welcome your ideas for how to make sense of this finding!
Call to Action
We need to rethink how we report environmental pollution. Instead of feeling guilty about the carbon footprint of your Netflix binges or sweating over turning lights off—things that lead to very few real alternatives—let’s turn our attention to the handful of producers who play an outsized role in generating emissions in the first place and scrutinize their decision-making and investment practices. Divestment, nationalization, restructuring, boycotts, and other forms of collective action are all on the table.
We invite you to run the notebook for yourself and to zoom in on a specific state and/or type of owner in the data. Share what you find with us, and don’t hesitate to let us know about any technical issues you encounter. Get in touch here.