
By: Kyle Carney, Eric Nost, Jennifer Epstein, Kimberly Barrett, Carly Hagen, Christopher Cane, and Shannan Lenke Stoll
This is an installment of our State of Environmental Protection series. This series utilizes public data from the U.S. Environmental Protection Agency (EPA) to evaluate the current state of our environment and recent trends over time, as well as claims and assumptions behind attacks on federal environmental justice, science, and health. We investigate the progress made since the Clean Air Act, the Clean Water Act, and numerous other environmental laws were put into effect during the 1970s. Moreover, we seek to understand the landscape of environmental regulation, responsibility, and harm originating from industry in the United States.
Surface waters (better known as rivers, lakes, and reservoirs) touch the lives of every American family. The story of surface waters is ultimately a story of accumulation. Clouds carry water inland, rain distributes water over large regions, and gravity eventually returns water to the ocean. As a drop of water makes its journey home, it will merge with other water sources until a creek becomes a stream, a stream becomes a river, and a river flows into the ocean. In order to store water for human use, some river water is diverted into man-made reservoirs where it can be saved and used by local communities. This process is how farmers produce crops during the full growing season, cities have enough fresh water to drink, and families have recreational spaces to fish and enjoy long summer weekends.
Unfortunately, surface waters also accumulate hazardous chemicals as they flow downstream. Creeks can collect pesticide and herbicide runoff from nearby farms, and rivers are frequently used and contaminated by industrial processes. Extractive industries like mining and oil and gas are especially significant contributors to water pollution. Left unchecked, industries can contaminate surface waters to such severe levels that they become public health risks. In fact, the modern environmental movement emerged in part as a response to the public’s outcry to Rachel Carson’s book Silent Spring, as well as widely-publicized industrial water pollution catastrophes, such as the 1969 Santa Barbara Oil Spill and the 1969 Cuyahoga River Fire.1 As public concern over environmental pollution grew,the Environmental Protection Agency (EPA) was established in 1970 to protect human and environmental health. The EPA is authorized to enforce environmental regulations such as the Clean Water Act (CWA), which regulates pollution with the explicit aim to “restore and maintain the chemical, physical, and biological integrity of the Nation’s waters.”
However, the authority of the CWA has been chipped away recently. In the 2023 ruling Sackett v. EPA, the U.S. Supreme Court decided that the “waters of the United States” includes only those wetlands with a continuous surface connection with permanent, large water bodies like streams, oceans, rivers, and lakes. As a result, an estimated area of 17 to 90 million acres of wetlands can now be polluted without any penalties from the EPA. For context, 17 million acres is about the size of West Virginia and 90 million acres is close to the size of Montana. While the Biden administration responded to this ruling with targeted changes to the definition, The Trump EPA under Administrator Lee Zeldin has embraced this ruling and has announced plans for a broad revision of the definition, prioritizing business interests and corporate profits.
Current surface water regulations are also slow to limit the impact of emerging chemical hazards. In recent years, the American public has grown increasingly concerned about the widespread pollution of PFAS, commonly known as forever chemicals. The full public health risks of PFAS exposure are not entirely understood. However, studies have shown that PFOS and PFOA (two well known types of forever chemicals) can cause health issues, particularly in the immune system. Despite this, on May 14, 2025, Administrator Zeldin announced that the current administration will delay regulations limiting the amount of PFOS and PFOA in drinking water to 2031. Furthermore, Zeldin announced that the EPA will also rescind drinking water limits on four other forever chemicals, including GenX. Zeldin’s EPA has also signaled an industry-friendly stance when it comes to PFAS reporting requirements for chemical manufacturers and has cancelled millions of dollars worth of PFAS research grants. These actions permit chemical makers to continue dodging regulation by refusing to disclose information while simultaneously demanding evidence of harm, significantly hobbling EPA’s ability to protect people from PFAS pollution.
These regulation shifts are especially alarming given our current understanding of the state of pollution in surface waters. The second Trump administration offers conflicting views on the level of water contamination. In March, Administrator Zeldin proclaimed “the greatest day of deregulation that our nation has ever seen” which included a reconsideration of wastewater regulations for oil and gas development. On the other hand, The MAHA Report released by the White House lists contaminated drinking water as a factor leading to higher rates of chronic illness in children. This blog post hopes to offer insight into the situation by analyzing the pollution data the EPA has collected over the last 20 years.
RSEI Data Explained
Risk-Screening Environmental Indicators (RSEI) is a model and prioritization tool managed by the EPA. The RSEI is based on over 30 years of the EPA’s Toxic Release Inventory (TRI), which tracks certain toxic chemical releases from nearly 20,000 federal and industrial facilities across the United States. For reported water releases, chemical concentrations are modeled downstream of each facility. The RSEI model then calculates the risk of potential human exposure resulting from either eating contaminated fish or drinking water retrieved downstream from a facility.
The public health risk of each potential exposure is represented by the RSEI risk score value. The risk score is a function of the chemical’s hazard level and the size of the exposed population. For example, a water discharge of a moderately hazardous chemical upstream of the drinking water supply for a large city would have a higher risk score than the discharge of a highly hazardous chemical in a sparsely populated region. RSEI scores are designed to be comparative, not absolute, measures of risk. They do not give us a sense of how likely a water pollutant discharge is to cause harm, but they do tell us how much more of a threat one discharge is compared to another. And because the RSEI model relies solely on these facilities’ self-reporting of regulated toxins, RSEI results do not account for the full scope of water pollution’s impact on community health. For all of the following analysis, the data has been specified to only consider RSEI reports from 2001-2022 (the latest year for which RSEI results are currently available).
Chemical Discharges Over Time
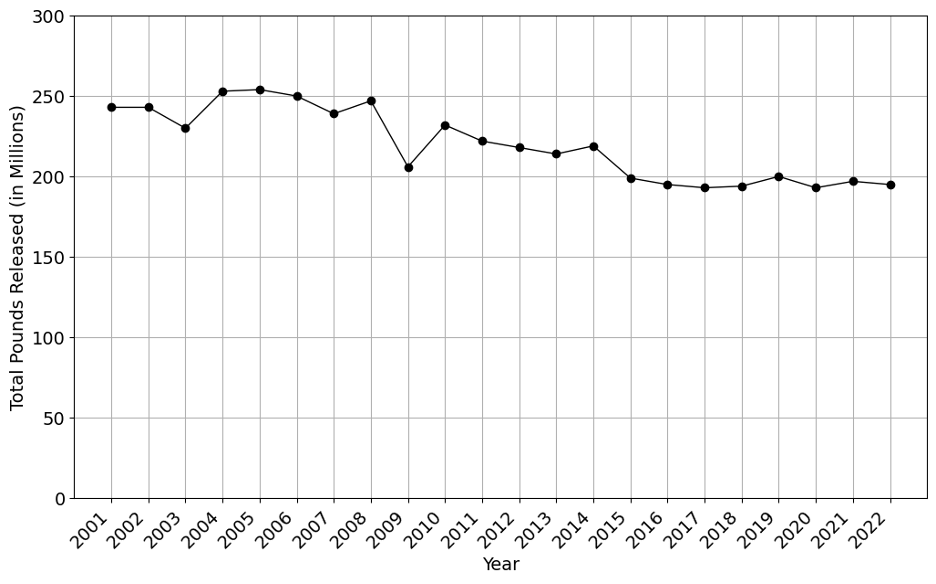
The total amount of chemicals discharged into surface waters has decreased over time, with 243 million pounds discharged in 2001 and 196 million pounds in 2022 (Figure 1). This represents a decrease in pounds discharged by about 20 percent. However, the total amount of chemicals released generally stopped decreasing in 2015. From 2015 to 2022, there was actually a 2% increase in the amount of chemicals released. In other words, the total amount of chemicals being released into surface waters is about the same today as it was in Trump’s first term.
RSEI Risk Score Over Time
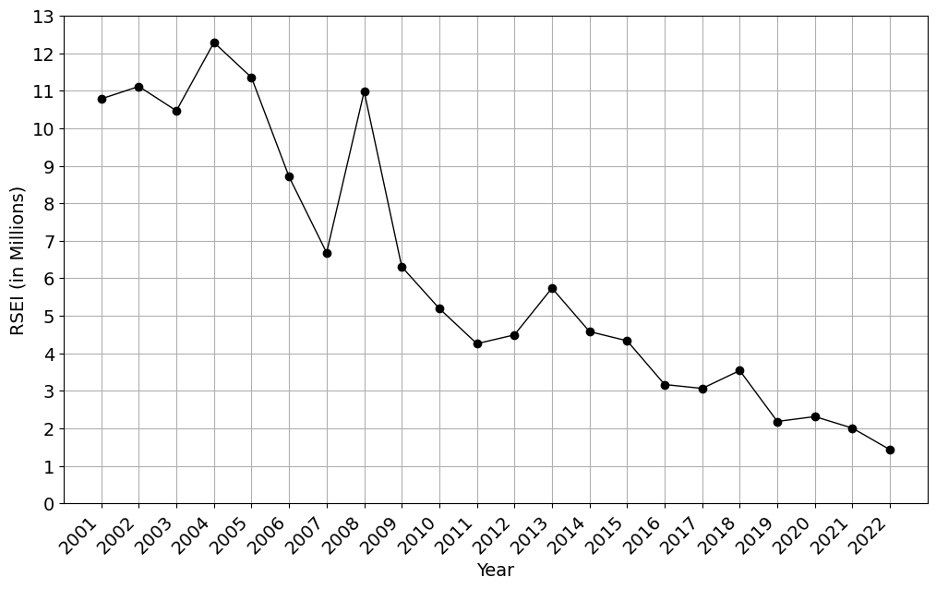
An RSEI score is a numerical estimation for the risks associated with a particular water discharge. Therefore, summing the RSEI scores across all discharges represents the total public health threat due to contaminated surface waters that occurred during a given year. Figure 2 shows the total RSEI score for water discharges was relatively high during the early 2000s. Exposure risks generally decreased over the past 20 years, with the exception of the spikes in risks occurring in 2008 and 2012. However, this momentum was lost during the first Trump administration, with the total Risk Score actually increasing from 2016 to 2019. It is worth noting that 2020 likely saw a decrease in the exposure risk due to the economic effects of COVID lockdowns.
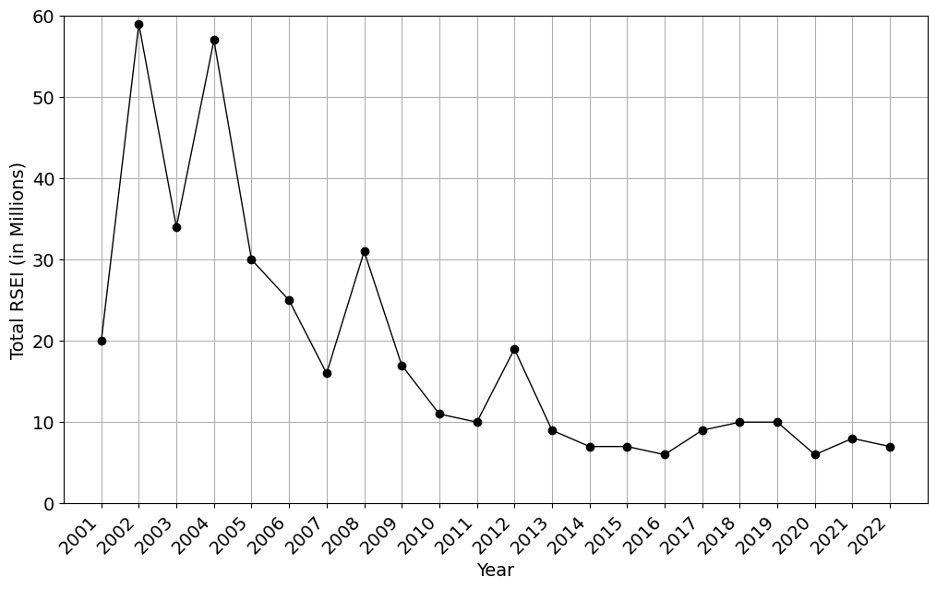
One promising trend emerges from this data. Recall that from 2001 to 2022 the total pounds of chemicals discharged decreased by about 20%. However, the total Risk Score decreased from 21 million in 2001 to 7.1 million in 2022, or about 66%. This suggests that the exposure risk drastically decreased as a result of a relatively small drop in the total weight of chemicals released. This dynamic may be the result of several potential factors. For example, it may be driven by a reduction in potent toxins for which only a few pounds may cause high exposure risks. Alternatively, relatively heavy toxic chemicals may have been replaced by lighter, less toxic chemicals. Because the RSEI score is also a function of the number of people exposed, its decrease over time could also be a function of changes in where toxics are released.
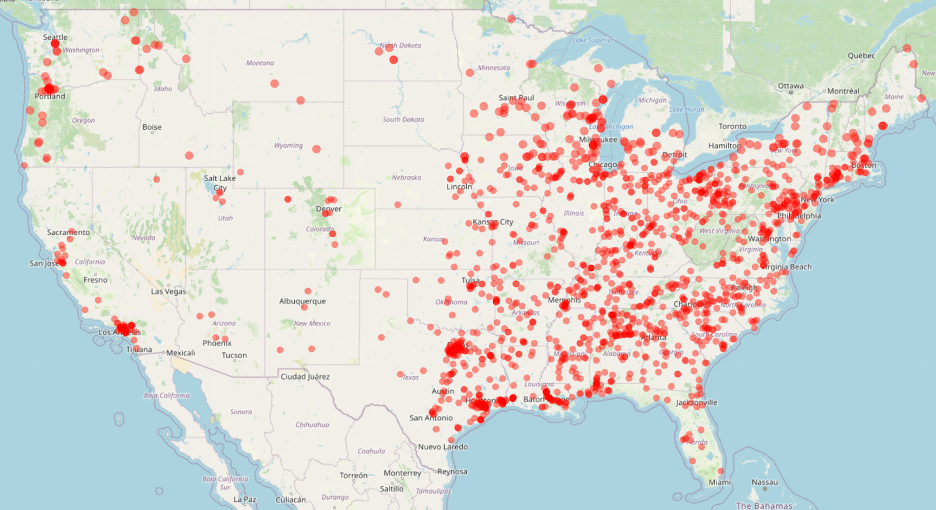
Our analysis shows that the rise in the risk score between 2016 and 2019 was driven by 1588 sites that had higher exposure risks during the first Trump administration than the second Obama administration. The location of these sites is shown in Figure 3. Generally, sites that had an increased Risk Score are concentrated in the eastern half of the country as well as in population hubs in the west.
Permitted Discharges Over Time
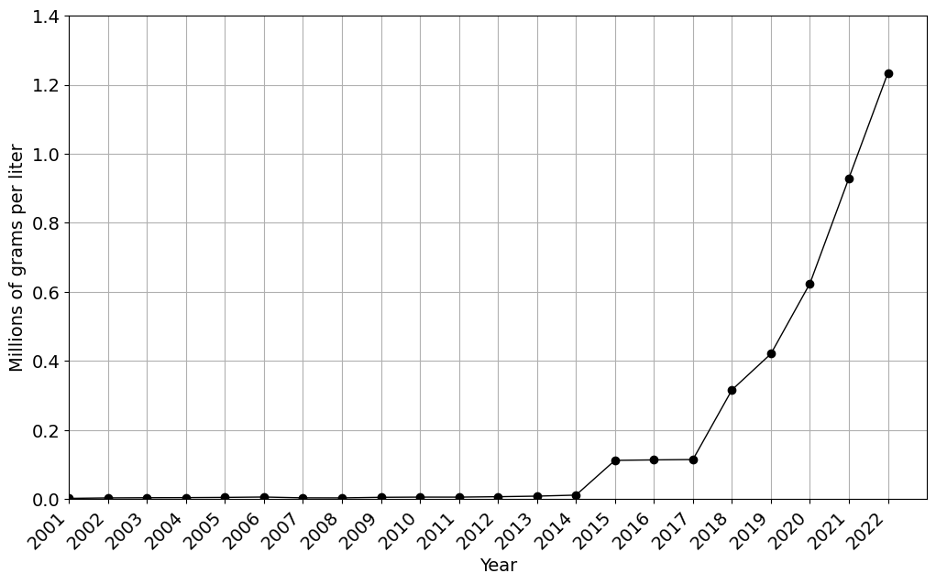
The CWA allows regulated amounts of chemicals to be released into surface waters. Figure 4 shows the total concentration of chemicals permitted to be discharged has grown exponentially, with a 20 year increase of over 550%. In 2001, across the entire U.S., EPA and state-level agencies permitted a total of 2,194 grams per liter to be discharged. In 2022, a total of 1,230,000 grams per liter were permitted. This trend can partially be explained by better record keeping resulting from a switch to electronic records that occurred in 2015. However, even the years following this transition have seen a large increase in permitted discharges.
Mercury Discharges to Surface Waters
Mercury and mercury compounds are among the most hazardous materials that naturally occur on the surface of the earth. Mercury contamination occurs through natural (e.g. weathering of rocks, forest fires and volcanic eruptions) and human (e.g.mining operations, fossil fuel burning, and cement production) processes, though Wu et al. note that, “about 90% of mercury compounds are emitted by human activities.” Most of these sources release mercury into the air, which eventually settles into soil and surface water. Mercury in the atmosphere can travel great distances before settling. As a result, mercury may pollute water systems far from the initial source. Exposure to mercury compounds can cause a variety of acute and chronic illnesses including cancer, neurological disorders, and birth defects. The Safe Drinking Water Act currently allows a permissible drinking water concentration of 2 μg/L. However, the mercury level in most watercourses is above this amount.2 Even President Trump’s MAHA Commission explicitly identified mercury as an environmental contaminant that poses a risk to children.
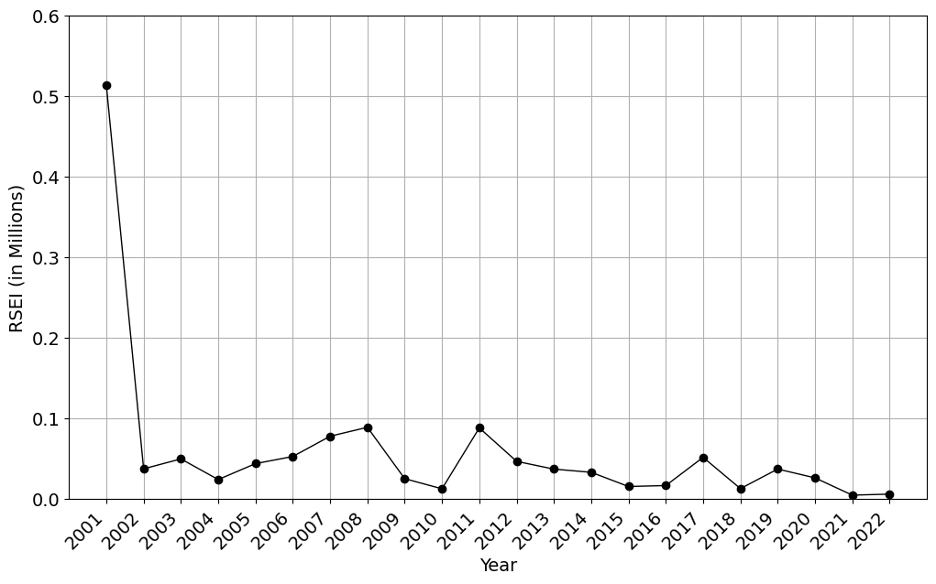
Figure 5 shows the risk score for mercury is generally low and has been relatively stable over the last 20 years, with small peaks during 2008 and 2011. However, since then the exposure risk of mercury has generally decreased.
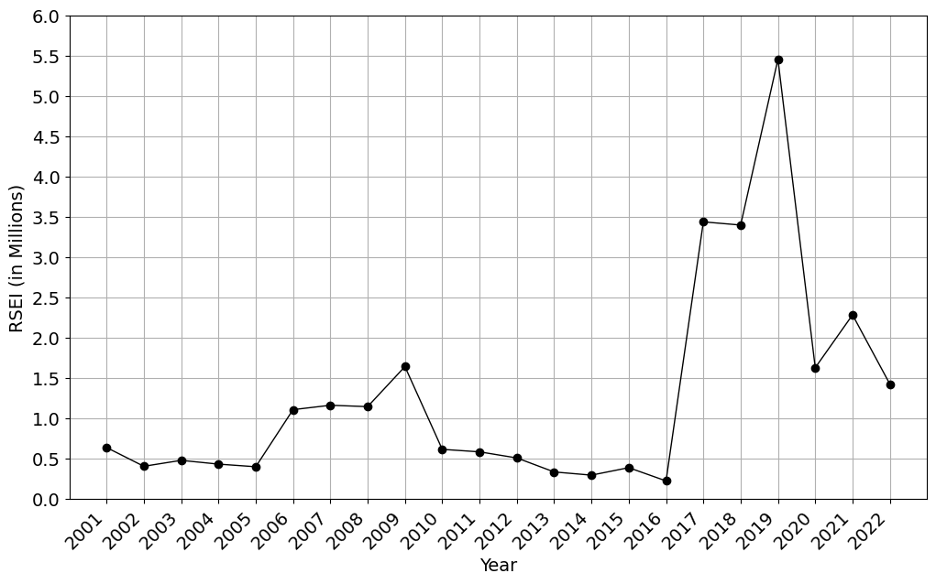
Mercury compounds are formed when mercury combines with other substances. Mercury compounds remain very toxic and can result in similar health issues as plain mercury. Figure 6 shows that the risk score for mercury spiked in 2017, peaks in 2019, and begins decreasing the following year.
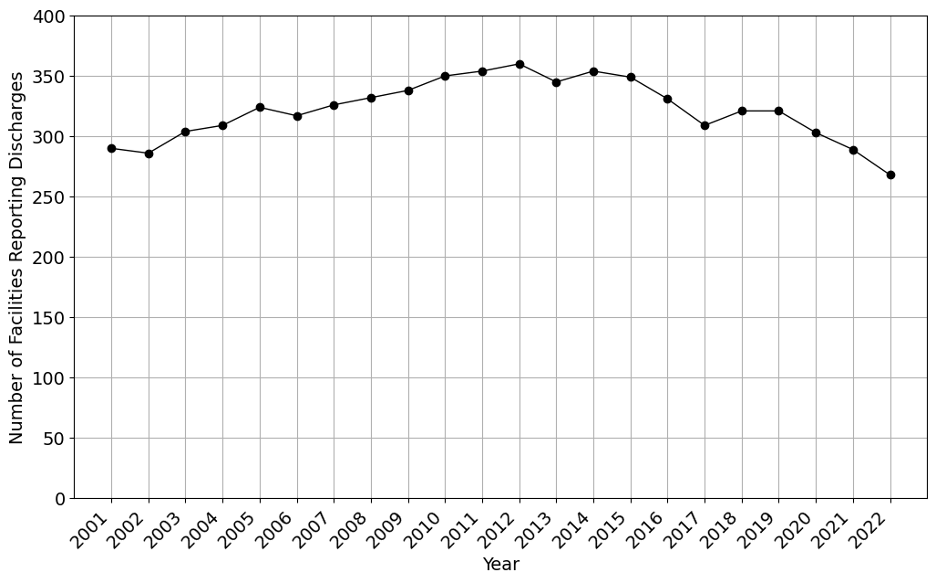
In order to understand what drove the higher exposure risks of mercury compounds during President Trump’s first term, we investigated how the number of facilities detecting mercury compounds changed over time.
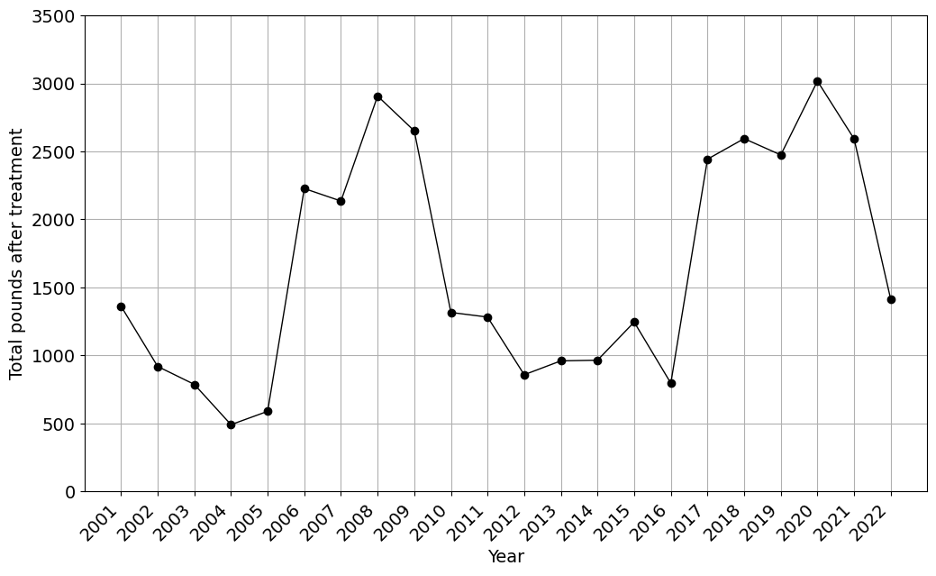
To complete our investigation, we explored how the total amount of mercury compounds reported has changed over time. Figure 8 shows the amount of mercury compounds released spiked in 2017 and did not fall until 2022. Therefore, the higher exposure risks are the results of fewer facilities releasing more mercury compounds. The Trump administration’s exemptions to Biden-era rules limiting mercury emissions could produce similar effects by increasing mercury emissions limits at selected facilities, exacerbating the existing trend.
Effectiveness of Current Regulations
Arsenic and arsenic compounds are commonly found in the environment and the product of both natural and societal processes. Natural sources include mineral breakdowns and biological pathways while societal sources are generally the result of industrial processes such as gold mines, fossil fuel combustion, and pesticides (see here). Arsenic is also used to make semiconductors. Worldwide, millions of people are exposed to arsenic and arsenic compounds through contaminated drinking water. Arsenic and related compounds are known carcinogens that have been linked to lung, bladder, skin, kidney, liver, and prostate cancers. Furthermore, arsenic exposure has been linked to diabetes as well as cardiovascular disease.
Figure 9 shows the RSEI score for arsenic compounds, decreased since 2004. Up until 2004, the U.S. was the world’s largest consumer of arsenic. The vast majority (>90%) was used for the manufacture of pressure-treated wood, primarily as chromated copper arsenate (CCA). Residential uses of CCA were discontinued in 2003, though it is still used to produce wood for industrial uses. Most uses of arsenic-based pesticide products were phased out between 2009 and 2013.
These developments can be seen in the risk scores over time: From 2001 through 2004, nine wood preservation facilities accounted for the single largest source of public health risk from arsenic. Between 2005 and 2012, this dropped to five facilities and they constituted only the second largest source of risk. Since 2012, only two wood preservation facilities have reported releasing arsenic into surface waters, and hazardous waste treatment and disposal and industrial gas manufacturing have become the largest remaining sources.
The wood preservation industry’s phaseout of CCA was described by EPA as “voluntary” and the industry itself pointed to declining demand for the product, but both of these perspectives overlook the context of existing EPA policy restricting arsenic-based pesticides and civil society actions including lawsuits. The current Trump EPA emphasizes similar kinds of “collaborative” approaches with industry, but collaboration without pressure may simply provide industry more opportunity to pollute (as in the exemptions policy described above). In general, collaboration provides the public much fewer assurances and mechanisms for accountability than regulation.
Conclusions
Our analysis shows that surface water pollution is widespread around the country and remains a public health risk. We found that health risks associated with contaminated surface waters increased during the first Trump administration. Furthermore, the total amount of chemicals being introduced into the surface waters has not meaningfully fallen since 2015 and some toxic chemicals (such as mercury compounds) have actually become more widespread over the last 10 years. These trends contradict the intent of the CWA, which was designed to progressively decrease the overall amount of pollution allowed to be discharged into surface waters through increasingly stringent permits. In fact, the very first goal stated in the 1972 CWA was to eliminate pollution discharge by 1985. On the other hand, the planned deregulations by EPA Administrator Zeldin will likely increase the public health risks posed by polluted surface waters. Chemical restrictions clearly improve water quality, but a “partner with industry” approach delays the onset of those declines. Instead, clear regulations and enforcement are needed to improve water quality and protect public health and the environment.
Our analysis is focused on water pollution levels across the entirety of the U.S. In order to understand water pollution in your neighborhood, please use EDGI’s Watershed tool. We developed this tool to help researchers and advocates investigate the facilities impacting local waterways and access the data needed to hold them accountable. Also, be sure to check out EDGI’s Congressional Report Cards for a summary of corporate compliance with environmental protection laws in your Congressional district.
- While the 1969 fire in particular captured significant media attention, the National Park Service notes that the Cuyahoga River “burned more than 10 times over the previous century.” [↩]
- The RSEI score calculation assumes drinking water is always treated to be under the maximum contaminant level permitted for a given year. [↩]