
By: CeCe Street, Eric Nost, Christopher Cane, Harrison Hutton, Steve Hansen, Carly Hagen, and Shannan Lenke Stoll
This is the first installment of our State of Environmental Protection series. This series utilizes public data from the US Environmental Protection Agency (EPA) to evaluate the current state of our environment and recent trends over time, as well as claims and assumptions behind attacks on federal environmental justice, science, and health. We investigate the progress made since the Clean Air Act, the Clean Water Act, and numerous other environmental laws were put into effect during the 1970s. Moreover, we seek to understand the landscape of environmental regulation, responsibility, and harm originating from industry in the United States.
The Environmental Protection Agency’s (EPA) Risk-Screening Environmental Indicators (RSEI) (version 2.3.12) is the primary source for the following analysis. However, the RSEI model relies on industries’ self-reported releases of regulated toxins from their facilities, meaning that the data does not account for the full scope of air pollution’s impact on community health. The inadequate nature of this data creates a burden on impacted communities, perpetuating environmental justice concerns. Due to the importance of maintaining a lens of environmental justice when working with environmental data, people are working diligently to create useful tools after the loss of EJ Screen in February of 2025.
Keeping in mind the limitations of RSEI data, we find that the reported quantity and public health risk of many air toxins have declined since the 1970s. However, millions of Americans are still exposed to harmful chemicals, with communities of color and low-income communities especially impacted. Reported releases of over one hundred air toxics actually increased during Trump’s first administration, one third of which are carcinogens. At the same time, many facilities are under-regulated and minimally penalized for infractions, leading to problematic outcomes.
RSEI Explained
Our analysis draws on data from both the EPA’s RSEI and Enforcement and Compliance History Online (ECHO) databases.1 RSEI models how industry self-reported estimates of regulated pollutant emissions disperse from smokestacks. Using information about the toxicity of those pollutants, alongside Census information about who lives where, RSEI can provide a sense of both how hazardous a specific set of emissions is and the risk to public health.
Imagine a coal power plant in an isolated area. It might report 1,000 pounds of mercury for a given year. This would then be multiplied by the EPA’s standard toxicity weight for mercury, giving us a relative sense of how hazardous the plant’s mercury emissions are compared to mercury and other pollutant releases elsewhere. If the plant’s mercury emissions do not disperse very widely, it may prove to be less risky according to RSEI’s models since there are fewer people exposed. Emissions of fewer hazardous materials may be more risky to public health if they are released and dispersed closer to population centers.2 In other words, the RSEI Score is made up of several factors including: 1) the amount of a pollutant dispersed in an area, 2) the toxicity of the pollutant, and 3) the number of people likely to be impacted. RSEI Scores are designed to be comparative, not absolute, measures of risk.3 They do not give us a sense of how likely an air pollutant release is to cause cancer, but they do tell us how much more of a threat that release is compared to another.
Air Toxics Over Time
This chart illustrates air releases reported to the TRI and modeled for their public health risk by RSEI. It represents the sum of all RSEI scores for all chemical air releases each year from 2001-2022.

RSEI data show a significant decrease in the weight and estimated public health risk of air toxics since 2001, with a substantial drop in 2008. This may be due in part to the Great Recession, with high-emitting industries (e.g., construction, steel, automotive) closing or downsizing factories. Indeed, 2008 (430) and 2009 (422) saw the lowest numbers of different substances reported within the 21 year time-span. Similarly, the COVID-19 pandemic and associated recession may explain the low point in air toxins in 2020. While this may appear to substantiate right-wing claims like those from Project 2025 and EPA Administrator Zeldin that environmental regulation has done enough to improve air pollution, it is important to note that the overall decrease in air toxin risk to public health is not all encompassing (i.e. RSEI does not address air pollution from “non-stationary” sources like traffic and wildfires, nor that from smaller sources). Furthermore, as we dig into below, overall decreases seem to have flatlined during the first Trump administration, with increases reported for specific carcinogens.
If we look at the total risk score (again, risk score is the risk to public health that each chemical is estimated to have based on its toxicity, amount released, and location) for 2004-2008 for each chemical and compare it with the total risk score for 2017-2021 for each chemical, we see that the biggest drop was in ethylene oxide. The following is a graph that shows trends for the national sum RSEI score for ethylene oxide releases over time.
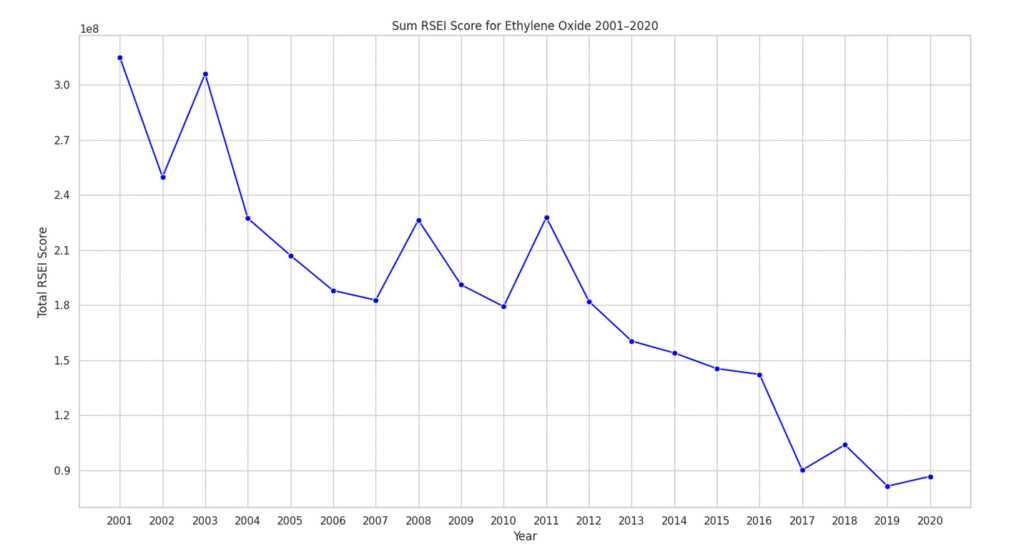
However, this progress in reducing ethylene oxide’s risk is threatened. The first Trump EPA politicized ethylene oxide regulation, while the Biden EPA finalized a rule to further reduce it. Industry actors like the American Chemistry Council are attempting to be exempted from this strengthened rule.
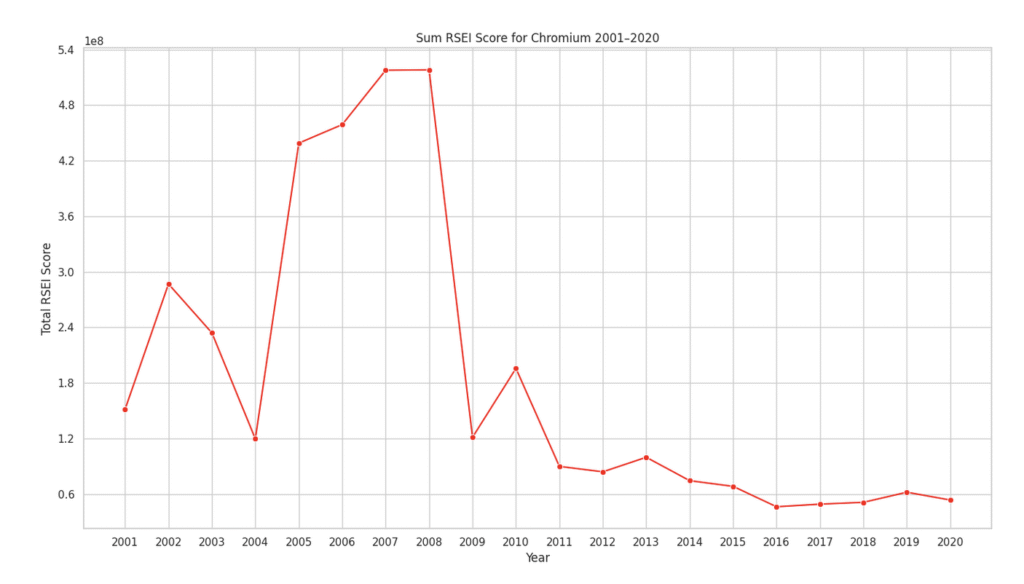
The risk score of chromium also dropped, especially between 2008 and 2009, but this may be due to: 1) difficulties in modeling and reporting the chemical, 2) the Great Recession, and 3) rules finalized around this time that regulated chromium sources. The following graph shows trends for the national sum RSEI score for chromium releases over time.
In short, most reductions in public health risk from associated air toxins were accomplished before the Trump administration’s first term, driven by decreases in chemicals that the administration sought to deregulate.
In fact, emissions of many chemicals – and the risks they pose – increased during Trump’s first presidency. The total risk scores of more than 100 tracked air pollutants grew; of these, about one-third are carcinogens. In some cases, this may be due to greater amounts of a chemical being released. In other cases, despite less of the chemical being released overall, more of the chemical may be released by facilities operating in areas where more people live. The chart below illustrates carcinogens with a risk to public health that grew under Trump’s first administration.
[Scroll and double-click a carcinogenic chemical name to isolate it in the plot view, then click additional carcinogens to compare their change over time.]
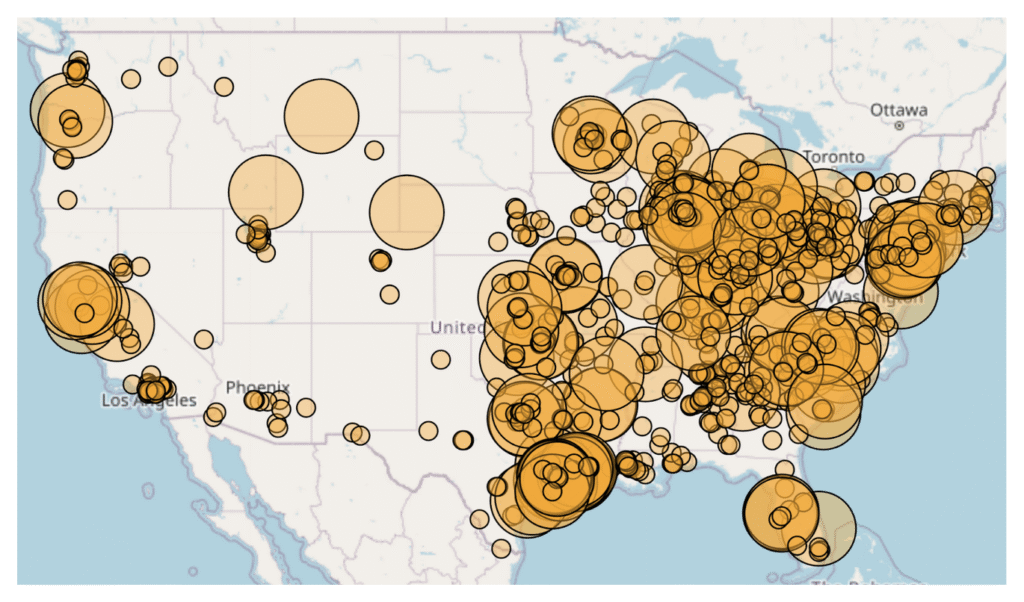
This map shows all of the locations where risk to public health posed by toxic air emissions grew during the first Trump administration. Facilities identified as commercial are represented by orange points, while facilities managed by the federal government, such as military bases, are shown as teal.
Whose Air Pollution?
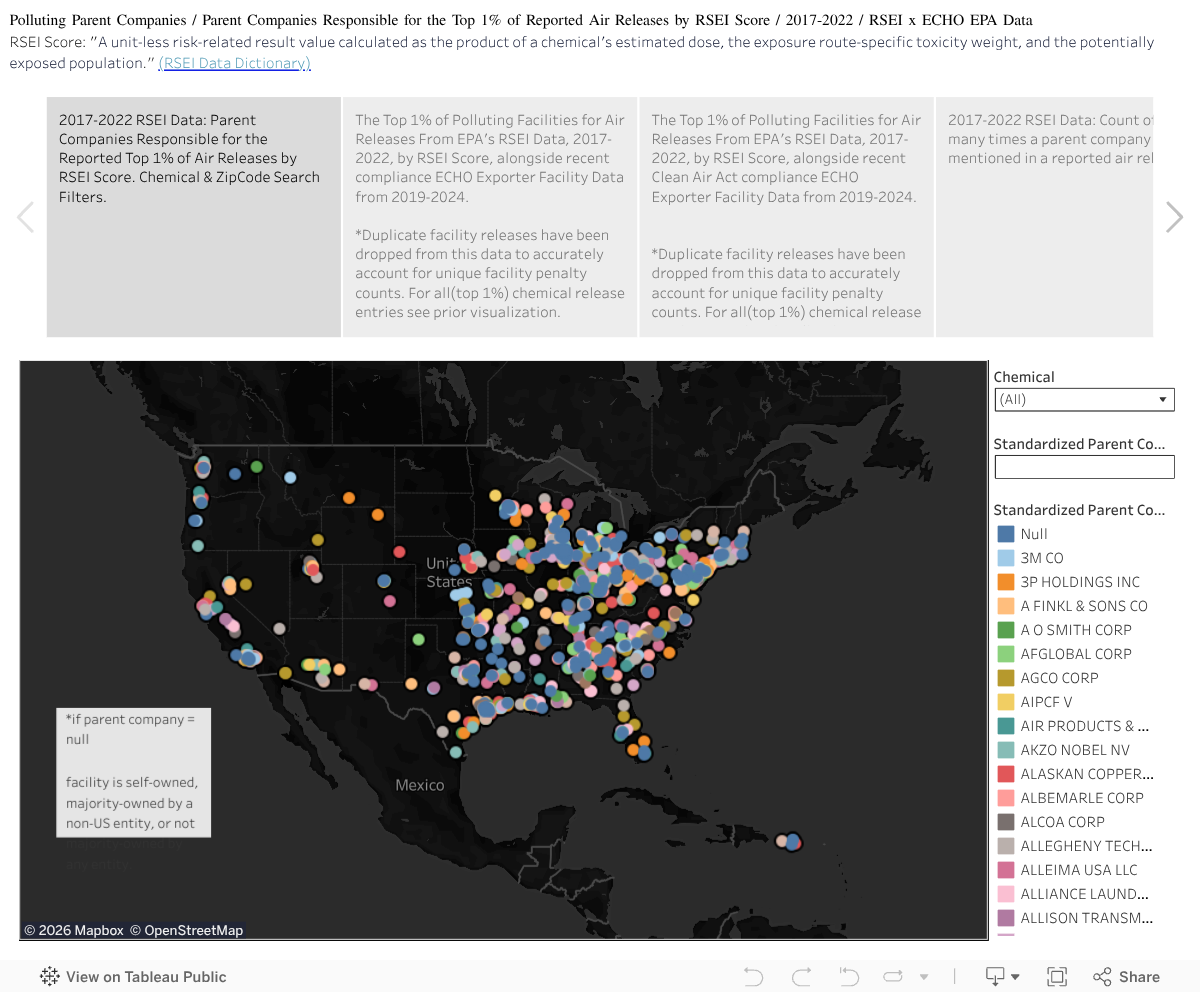
Air emissions are generated at specific facilities, led by the decisions of specific companies. The following visualization showcases the number of reported releases of air toxics by each facility’s “parent company,” which EPA defines as the US-based majority owner.
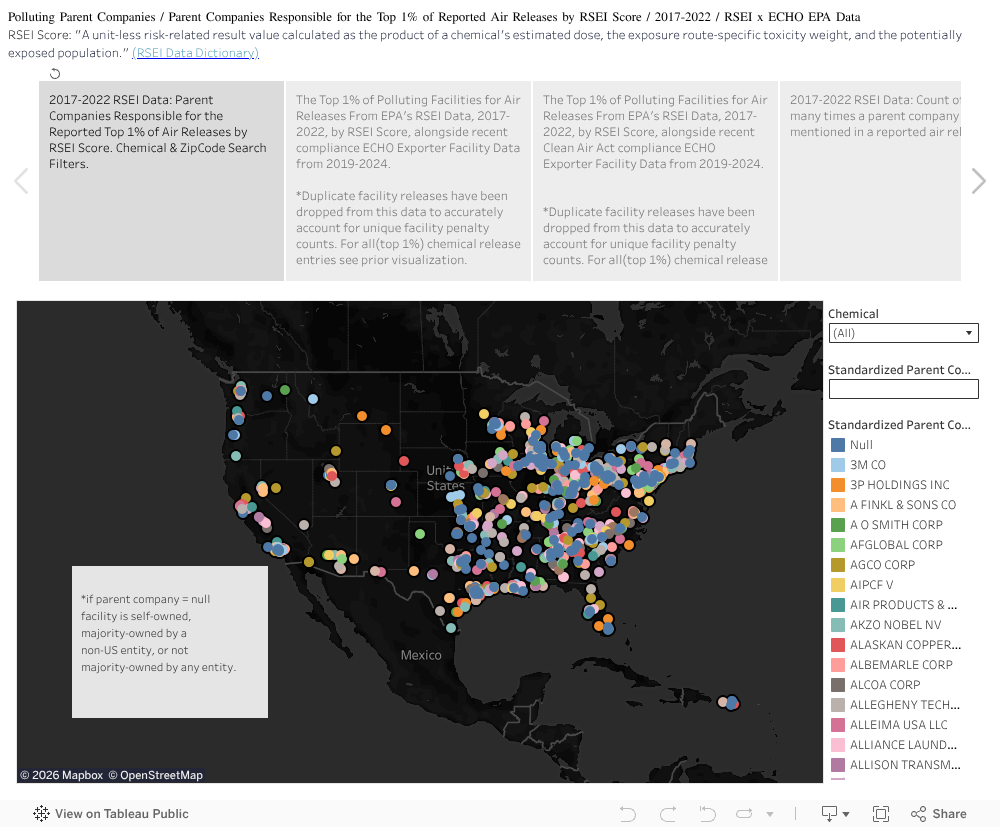
In this interactive visualization, you can select and view specific parent companies to find the number of facilities each company owns that are responsible for the top 1% of toxic releases posing the greatest risk to public health from 2017-2022.
The next visualization showcases the above data in map form, revealing the locations of the facilities responsible for the top 1% of all reported air releases by relative risk to public health between 2017-2022. In this interactive visualization, search by parent company name and filter by chemical released. Entries where the parent company name is missing are still shown.
Compliance with and Enforcement of the Clean Air Act
The analysis so far locates the companies that self-report chemical releases that pose a risk to public health. In all cases, these are legal releases – industry has permission to pollute by releasing these chemicals up to certain limits. However, some facilities may routinely or occasionally emit beyond these limits, potentially putting them in violation of the Clean Air Act. Of the 1044 facilities responsible for the riskiest air toxic emissions from 2017-2022, only 591 were inspected by state agencies or EPA during this time frame. Two hundred seventy-two facilities racked up 1,641 Clean Air Act violations (see map below). One facility – Chevron’s notorious refinery in Richmond, CA – accounted for 369 of these, or over 20%. Altogether, the facilities responsible for the “worst of the worst” air toxics have spent a total of 743 quarters in non-compliance with the Clean Air Act over the most recent five years.
When facilities violate the Clean Air Act, state or federal agencies may take action by mandating the facility return to compliance. Failure to do so might result in a lawsuit and an assessment of monetary penalties. The following visualization shows the count of formal Clean Air Act enforcement actions leveled by public agencies against facilities, juxtaposed with the penalties each facility received.
The data presented consists only of facilities responsible for the top 1% of reported air releases ranked by risk to public health from 2017-2022, with the subsequent penalty data drawn from a separate pool of 2019-2024 ECHO data. This means that in the penalty data for this visualization we are seeing the recent penalty action of the companies that were the “worst” offenders for air releases back in 2017-2022.

Despite regulatory negligence, companies such as Chevron and Ardagh Holdings Inc. often face minimal penalties. Chevron has consistently violated the Clean Air Act without facing adequate consequences. While the US EPA is moving to cut grants for environmental justice work, including projects in Richmond, CA, where Chevron runs a refinery, polluters are allowed to operate with impunity.
Conclusions
Air emissions in the United States pose a hazard to communities, and the current enforcement of the Clean Air Act falls harmfully short. Communities of color, low-income communities, and Indigenous communities predominantly bear the brunt of this negligence, with irresponsible emissions perpetuating environmental injustice. Additionally, more resources and tools are needed to amplify the reality of cumulative exposures in communities facing environmental injustice – the truth of communities’ exposure is not fully accounted for in the risk score of a single chemical release. The primary data explored in this blog post is self-reported by facilities, and not all encompassing. Given the current administration’s attack on public environmental data and community access, it is crucial to listen to and support frontline communities. Plugging into your local community is a great way to take action. Which organizations are advocating for clean air in your community? We’d love to work together – email us at environmentalenforcementwatch@gmail.com.
- According to the EPA’s website, the RSEI incorporates, “over 30 years of TRI [Toxic Releases Inventory] chemical reporting data, four U.S. decennial Censuses, toxicity and physicochemical properties for more than 400 chemicals, and geographical information for more than 100,000 facilities and thousands of streams and other water bodies.” [↩]
- This means that there is a strong urban bias in our analysis. In utilizing RSEI’s measure of overall risk, which accounts for the total population exposed, we are trying to avoid highlighting isolated toxic emissions that few if any people are actually exposed to. But this means we miss cases where polluting industries affect nearby small rural communities. In our next blog in the series, we look at air quality trends from a community perspective, rather than in terms of nationwide trends. This lets us illustrate specific cases – in both rural and urban areas – where air pollution is either a longstanding or emerging public health burden. [↩]
- The main RSEI metric is a “Score,” defined as the “dose [amount of pollutant dispersed to an area] multiplied by toxicity weight and by population [in an area estimated to be exposed], using the higher cancer/non-cancer toxicity weight for each air/water pathway.” (RSEI Data Dictionary). [↩]