By Leif Fredrickson
Last year EDGI started looking into the Environmental Protection Agency’s enforcement policies, practices and metrics, after our confidential interviewing project with agency employees suggested there were serious problems with enforcement under the Trump administration. Much has changed since our report, “A Sheep in the Closet: The Erosion of Enforcement at the EPA,” was first released in November 2018, most notably, the release of official enforcement numbers for the fiscal year 2018. As a result, we are releasing an updated report that expands and bolsters our analysis, using a broader range of enforcement metrics, a longer time span, and published numbers that are easy to verify.
Our original analysis, published in November 2018 as the report “A Sheep in the Closet: The Erosion of Enforcement at the EPA,” provided evidence that both staff and leadership believed that the practices, policies and rhetoric of the administration were inappropriately curbing enforcement. And we provided data that showed that enforcement numbers and staff had declined, and budgets were on the chopping block.
We concluded that the EPA was no longer so capable of fulfilling its mission to ensure competent enforcement of federal environmental laws. In place of that “gorilla in the closet” role characterized by its first administrator, William Ruckelshaus, it had become more of a sheep in the closet, threatening public health in the present as well as in the future.
Our updated analysis strengthens the conclusion that enforcement at the EPA under the Trump administration has been historically weak.
Because the official fiscal year (FY) 2018 numbers on enforcement are often not released until months after the end of the fiscal year (September 30), we used provisional numbers from the EPA’s enforcement database (Enforcement and Compliance History Online, or ECHO) in our original report. In addition to being provisional, this data only provides accurate data back to the early 2000s, is limited to civil case initiations, and is complicated to use.
In February of 2019, the EPA released its published, end-of-year enforcement numbers. This data has allowed us to compare a broader set of enforcement numbers back several decades. Most of the updated report concerns the analysis of this broader and deeper set of data. What follows are some of the key highlights of this analysis:
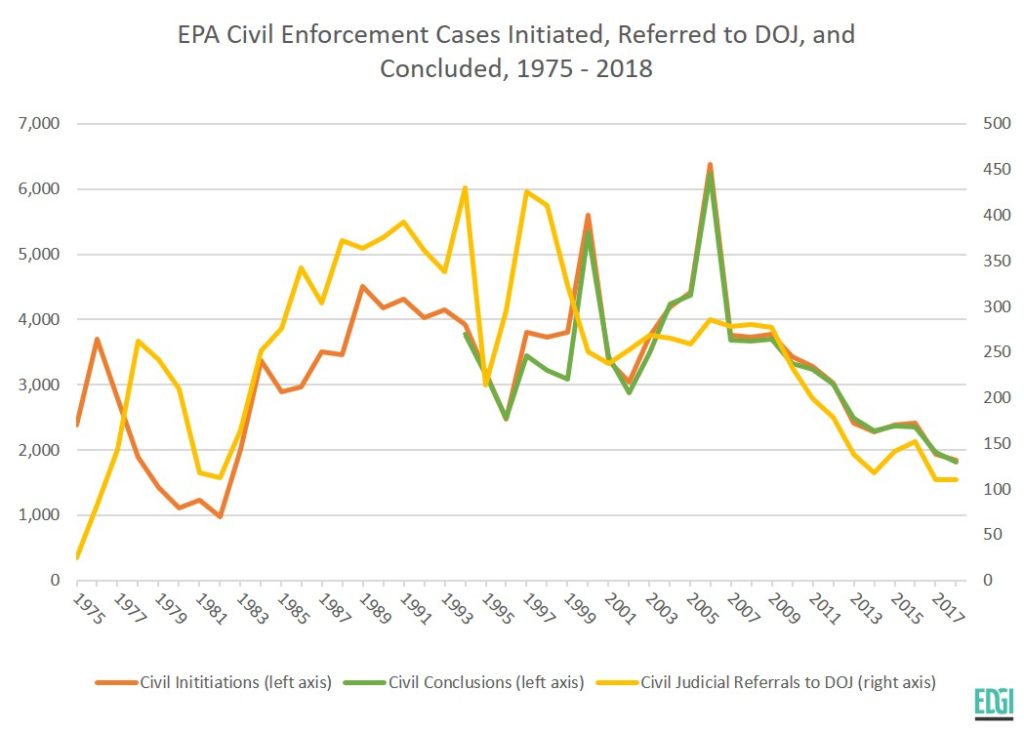
- Our original report only analyzed civil case conclusions back to 2008. Our new analysis shows that civil case conclusions in FY 2018 were the lowest since 1994, which is as far back as the record goes (Fig. 1). They were 53 percent of the average number of annual civil case conclusions from 1994 to 2016.
- Our original report did not include civil case initiations (new civil cases opened by the EPA). Our updated analysis shows that the number of initiations in 2018 was the lowest since 1982 (Fig. 1). Moreover the most serious civil cases initiated — judicial referrals to the Department of Justice — under the Trump administration in FY 2017 and 2018 were the lowest they have been since 1976.
- The original “Sheep in the Closet” report included little data on criminal enforcement because they are not a part of the ECHO database. Our updated analysis, however, showed that criminal enforcement was also weak in the Trump administration. Criminal case initiations in FY 2017 and 2018 were the lowest since 1992, and the number of criminal defendants charged in 2018 was the lowest since 1991.
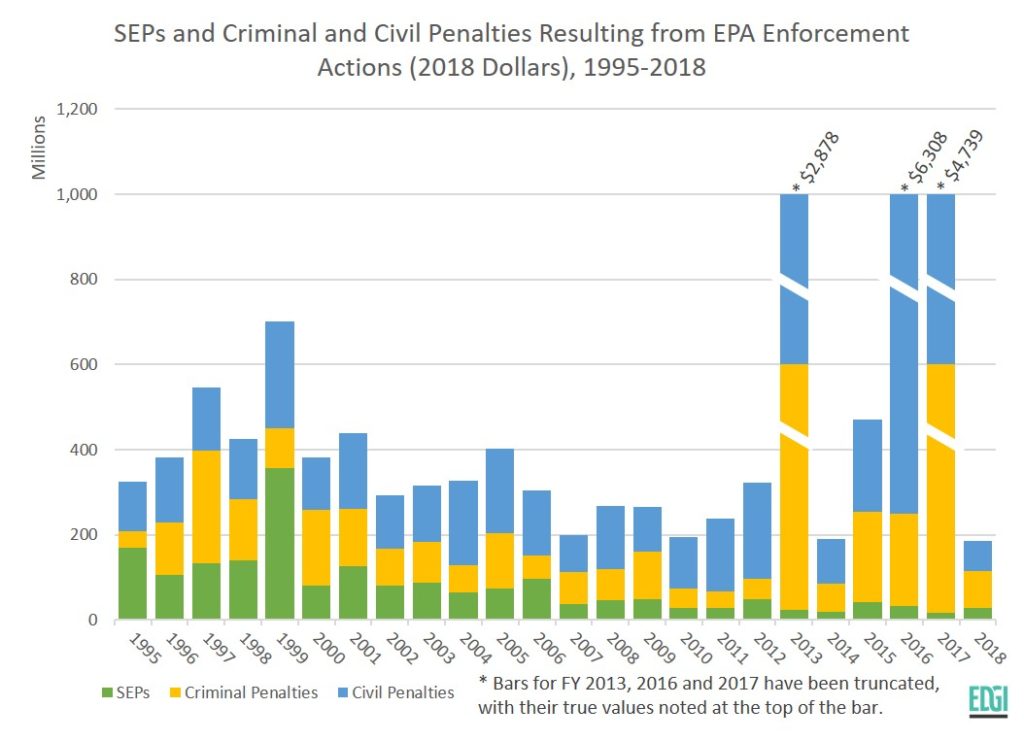
- In our original report, we only analyzed civil fines and compliance costs back to 2006. The new analysis extends back much further, showing that civil fines were the lowest they have been since 1994 and compliance costs were the lowest they have been since 2003 (both adjusted for inflation). The FY 2018 fines and costs were also far below the historical average (Fig. 2).
- Our new analysis also includes data on the estimated environmental benefits from enforcement actions. These estimates likewise point toward weak enforcement. For example, the combined estimate of reductions in pollutants and hazardous waste in 2017 and 2018 were the lowest on record (going back to 2008). The estimated number of people protected by enforcement of the Safe Drinking Water Act (SDWA) in 2018 was 505,000. In comparison, about ten times as many people were protected annually by the SDWA on average between 2002 and 2016.
- The updated report also includes a more complete picture of EPA inspections. The downloadable ECHO data does not include all inspections, but the end-of-year numbers do. Looking at FY 2018’s inspections numbers in historical perspective shows that it was the lowest year on record, with the record of inspections going back to 1994.
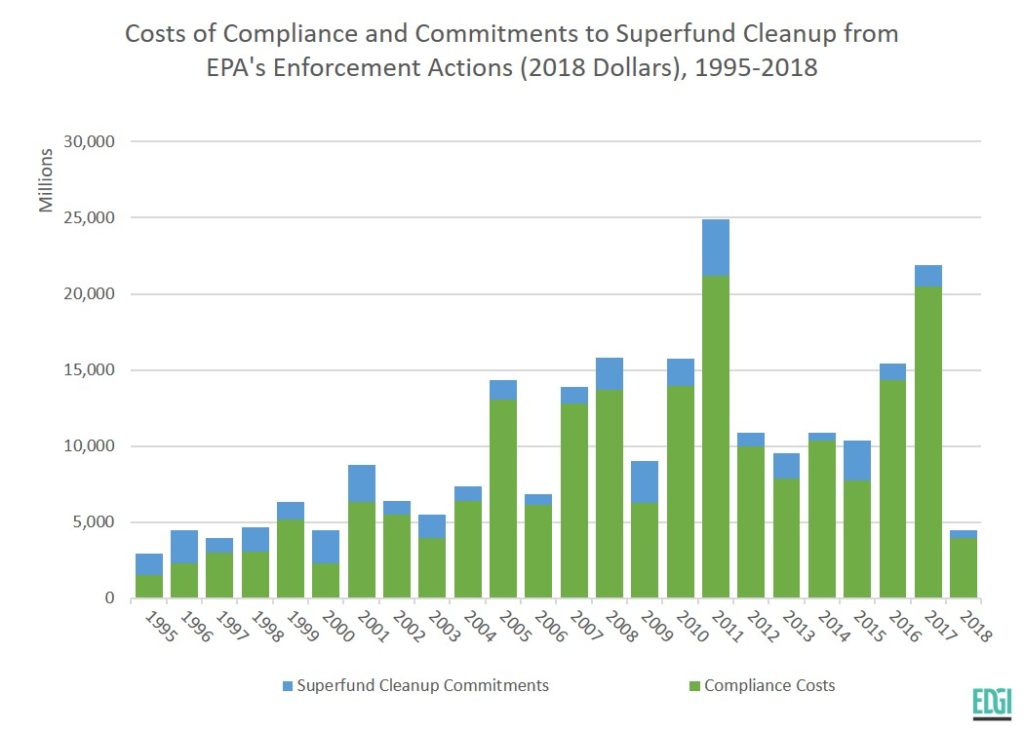
- Our original report did not include cleanup costs from the Superfund program. Our updated analysis shows that commitments to clean up Superfund sites were lower in 2018 than they have been since 1994, and were just 35 percent of the median annual Superfund cleanup commitments from FY 1994 to 2016 (Fig. 3).
More details and discussion on these and other numbers are presented in the report. It is important to emphasize that the numbers we use in the updated report came from EPA’s own published reports. Because EPA has been publishing reports for some time, we were able to collect that data and compare it over a longer time period than our original report did. In addition, these reports contain a more comprehensive view of EPA’s enforcement metrics. Finally, all of these reports are available online and we have included an extensive appendix with tables for all of our data and links to each data point that allow for easy verification.
Our updated numbers greatly strengthen the conclusion that EPA enforcement under the Trump administration is historically weak. A broad range of metrics in FY 2018 are the lowest they have been in decades (if not the lowest on record) and are usually far below the averages for previous administrations (i.e., from some period before 2016). All of this is according to the EPA’s own official numbers, which can be easily confirmed using our appendix.