
By: Jennifer Epstein, Eric Nost, Christopher Cane, and Shannan Lenke Stoll
This is an installment of our State of Environmental Protection series, where we use public data from the US Environmental Protection Agency (EPA) to evaluate the claims and assumptions behind authoritarian attacks on federal environmental justice, science, and health. We question the idea that we have made significant progress in reducing pollution since the major pieces of environmental protections, such as the Safe Drinking Water Act (SDWA), were put into place in the 1970s.
While the other blog posts in this series focus on pollution emitted from industrial facilities, this post focuses on the systems that supply drinking water. These systems are responsible for treating surface and groundwater to mitigate the harmful effects of ground and surface water pollution. Frequently, they are publicly owned and operated, but not always. This blog post uses Safe Drinking Water Act data to investigate patterns of drinking water violations and enforcement from 2001-2024, particularly how violations under the first Trump administration compare to other eras.
Safe Drinking Water Act Data
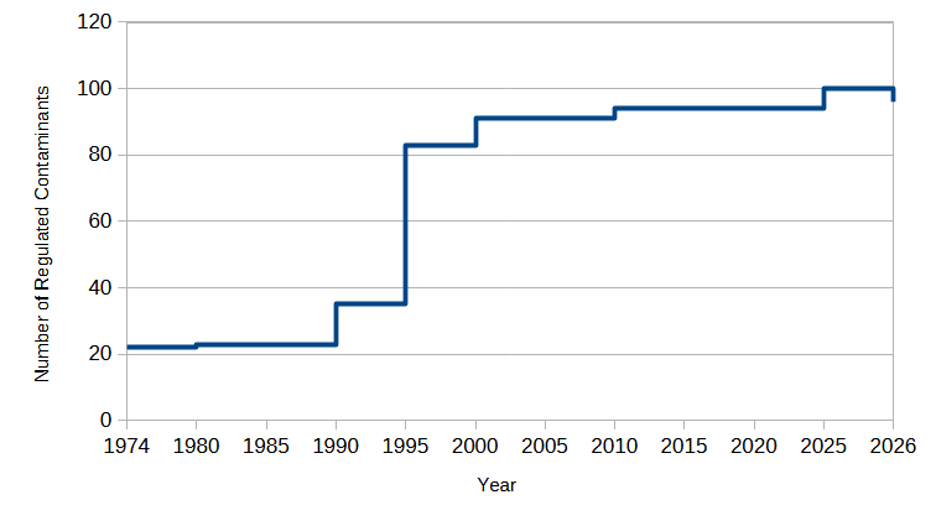
The SDWA was enacted in 1974, requiring U.S. drinking water systems to test their water and inform customers if water quality did not meet standards. The SDWA was the country’s first uniform set of nationwide drinking water standards. At the law’s inception, it included regulations on 22 contaminants which were explicitly intended as a starting point. In recognition of the first SDWA rules coming into effect in 1977, EPA Deputy Administrator Barbara Blum highlighted the need for additional standards to regulate anthropogenic chemicals:
We still have a long way to go, and many problems remain unsolved. The most notable of these is, of course, the widespread contamination of water supplies by small quantities of organic chemicals. With the exception of the six pesticides covered in the interim regulations, organics are not now subject to Federal regulation. Soon, that will change.
In fact, that change came slowly, and then not at all (Figure 1). EPA adopted new standards for about 60 organic chemicals in the late 1980s and early 1990s. Then, progress stalled. Today, about 100 contaminants are regulated under the SDWA. The most recent new standards were seven new PFAS standards added in 2024, the first new regulations to be added in about 20 years. Under the Trump administration, EPA has proposed to roll back all but two of these.
In addition to water quality standards, the SDWA also requires water systems to implement certain water treatment technologies and to notify customers about drinking water quality. In the same set of comments marking the implementation of the SDWA, Blum called the public notification requirements of the law its most “novel features,” and framed public notification as a source of public decision-making power. “In the future,” she said, ”consumers will know when their water supply systems encounter problems, and they can help determine solutions including how to pay for the improvements.” This type of public control and power requires that systems fully comply with these provisions of the law.
The SDWA is mostly implemented by states. It requires drinking water system operators to routinely test drinking water and report outcomes to states who then report some of this information—such as water system characteristics, violations, enforcement actions, and water quality data—to the EPA.
The following analysis is based on the most recent version of EPA’s SDWA dataset, current as of July 2025. The dataset covers 142,489 currently active public water systems (PWS), plus additional systems that were active at the time the historical violations occurred. (A note on terminology: The “public” in “public water system” refers to the people who receive the finished drinking water, not the system ownership; the data include a mixture of publicly and privately owned systems.) These PWSs include:
- 49,138 community water systems (CWS), which provide drinking water to residences;
- 76,410 transient non-community water systems, which provide drinking water to the public, but not the same people all the time (for example, a campground); and
- 16,941 non-transient, non-community water systems, which provide drinking water to the same group of people year-round, but not at their homes (for example, a school).
SDWA Violations Over Time
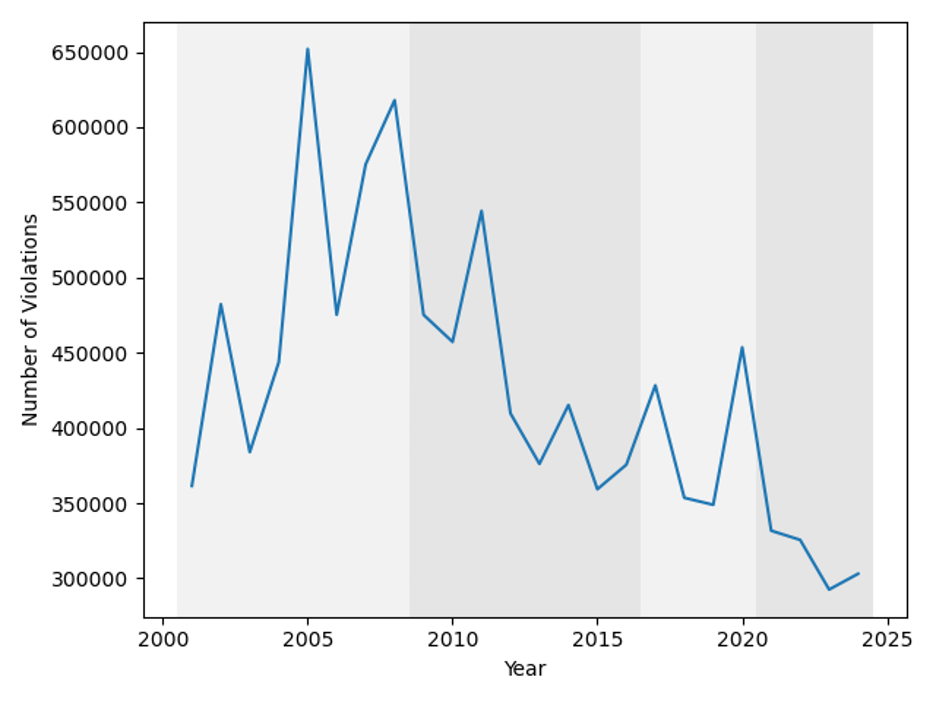
A total of 10,241,953 SDWA violations were reported for 169,533 water systems from 2001-2024 (Figure 2). The number of reported violations per year increased from 2001-2005. Since then, the number of reported violations per year has decreased overall, with many ups and downs in between. On average, violations increased during the Bush administration, declined during the Obama administration, increased during the first Trump administration, and declined during the Biden administration.
To understand what is behind these trends, it is useful to look at the types of violations in more detail (Figure 3).
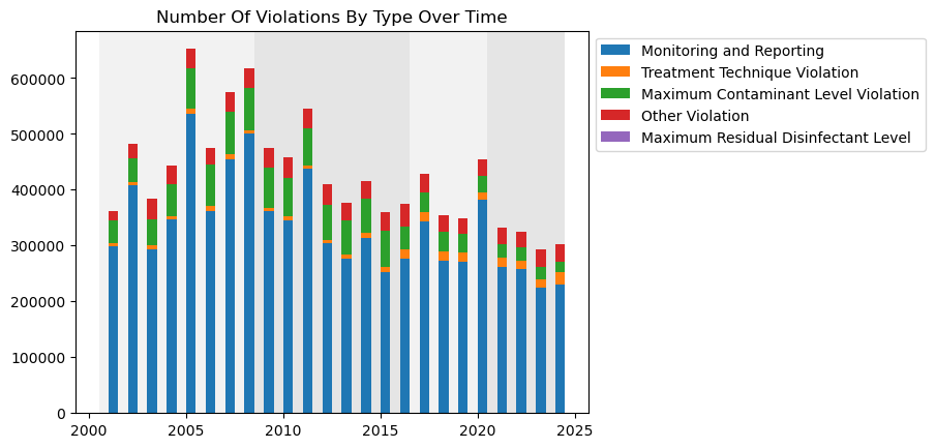
The majority of violations are monitoring and reporting violations. While these may be innocuous—a water system may have simply failed to submit its data on time, for instance—they may also obscure serious water quality problems, leaving the people who drink the water in the dark.
The number of reported health-based violations is a more direct measure of impact. This includes violations where regulated contaminants were detected above permitted levels or where required treatment methods were not used. The number of reported health-based violations increased from 2001-2006, then declined through 2023, briefly spiking in 2015 and climbing again in 2024 (Figure 4). The number of people affected by health-based violations has largely tracked the number of violations (Figure 4)
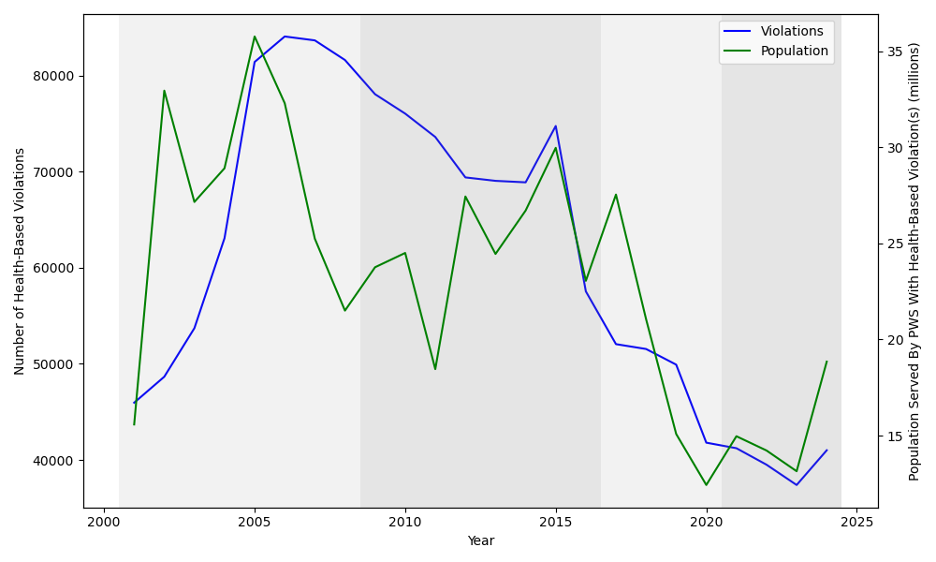
Although the number of health-based drinking water quality violations and the total number of people affected by them declined over the 2010s, it is important to remember that each year there are still 100,000s of monitoring and reporting violations levied against water systems. If water systems are not monitoring and reporting on their drinking water, then we cannot know the true extent of health-based SDWA violations.
Health-Based Drinking Water Violations and Drinking Water Rules
Every reported health-based drinking water violation relates to a specific SDWA rule. These rules focus on specific types of drinking water contamination, such as pathogens (Total Coliform rules and Surface Water Treatment rules), disinfection byproducts (Total Trihalomethane Rule and Disinfectants and Disinfection Byproducts rules), or metals (Arsenic Rule, Lead and Copper Rule).
Requirements for drinking water treatment technology or final water quality have changed over time, as new drinking water standards have been adopted or multi-phase rules have been implemented. Despite these changes, a few contaminants have consistently been responsible for most of the reported SDWA violations over the past 24 years (Figure 5).
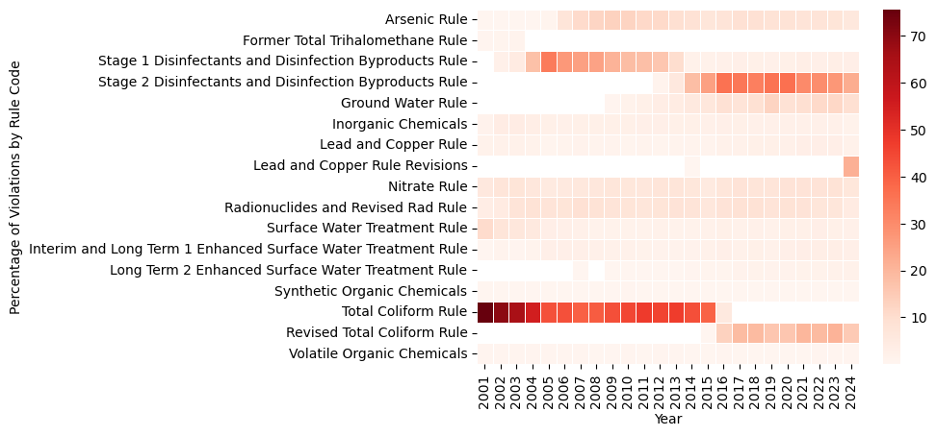
Two rules—the Total Coliform Rule (original and revised) and the Disinfectants and Disinfection Byproducts Rule (DBPR, Stages 1 and 2)—were cumulatively responsible for one-half to three-quarters of all reported violations from 2001-2023. Most other rules account for 10% or less of reported violations in any year.
The Total Coliform Rule was the most commonly cited in reported violations from 2001-2015, accounting for 39-76% of reported violations. In 2016, a revised rule became the second-most commonly violated rule and remained so through 2023, accounting for 13-21% of reported violations.
Stage 1 of the DBPR came into full effect in 2004, and Stage 2 followed in 2013. From 2004 through 2015, one of these rules was second-most commonly cited in reported violations. Starting in 2016, the DBPR (Stage 2) became the most commonly cited, accounting for 22-36% of reported violations.
Each of these rules (Fecal Coliform Rule & Revision, Stage 1 & Stage 2 DBPR) relates to microbes that cause gastrointestinal illness. Disinfection is the primary form of treatment against microbial pathogens, but the disinfection process can lead to the formation of harmful byproducts under certain conditions. The DBPR was developed to “balance the risks between microbial pathogens and disinfection byproducts.”
The persistent role of these two rule types in accounting for reported violations, even as the number of reported violations has declined, partly reflects the fact that EPA adopted very few new drinking water standards since the early 1990s. It is surely a good thing that SDWA violation reports suggest a decline in microbial contamination of drinking water, showing that the law is achieving its goal of protecting public health, at least with regard to this type of pollution. However, these reductions must be viewed in the context of EPA’s failure to adopt new standards, such as those promised for organic chemicals when the law was adopted.
Enforcement
Even if the number of people impacted by health-based violations has declined, whether these violations have been resolved is a separate question. In theory, violations that are quickly resolved through enforcement may be less harmful than violations that linger.
Enforcement action data fall into one of three categories: Formal, Informal, and Resolving. Informal enforcement actions are usually the first response. They are non-binding and non-punitive, including actions such as letters, phone calls, and visits. Formal enforcement actions come into play only after violations have affected drinking water for some time, and include enforceable compliance schedules. Resolving actions are those where a violator has come back into compliance (or where the rule no longer applies). In other words, a Resolving violation record should mean that the drinking water quality has been restored to required standards.
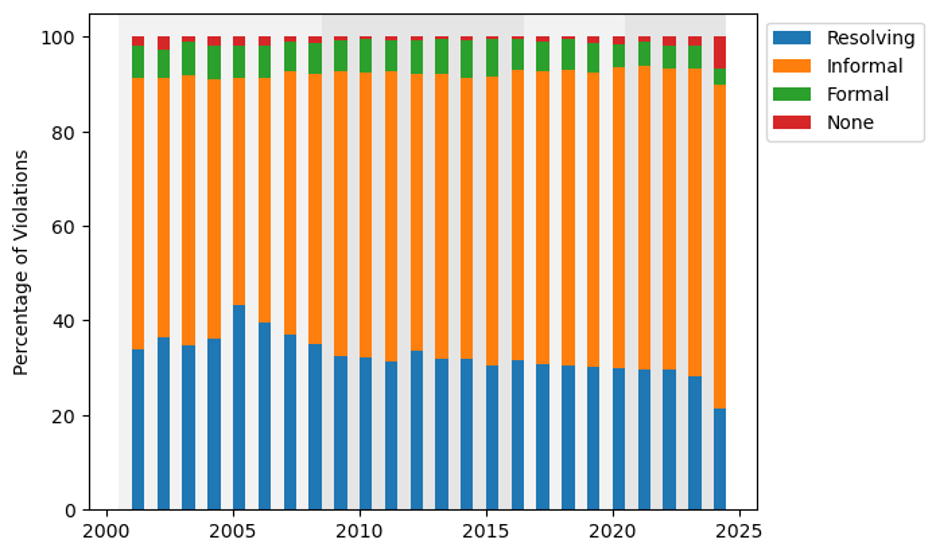
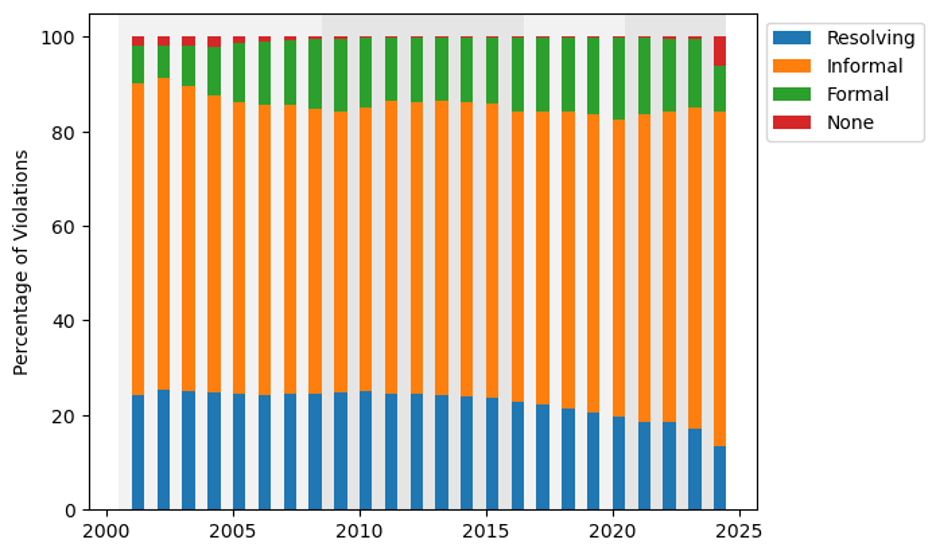
Unfortunately, since 2001, the majority of SDWA violations have not been categorized as Resolving. The percentage of violations in the Resolving category declined steadily since 2005, from 43% to 22% of violations (Figure 6). At the same time, the proportion of reported violations in the Informal category increased. This could indicate an interest on the part of state agencies to use mechanisms such as collaboration, rather than fines and legal action, to encourage providers to return to compliance. The picture is worse for health-based violations, for which Resolving violations maxed out at only 25%, declining to a mere 13% in 2024 (Figure 7).
SDWA Violations and Enforcement Across the States
As with other major U.S. environmental legislation, implementation of the SDWA is delegated to states. How do violations and enforcement vary across the U.S.?
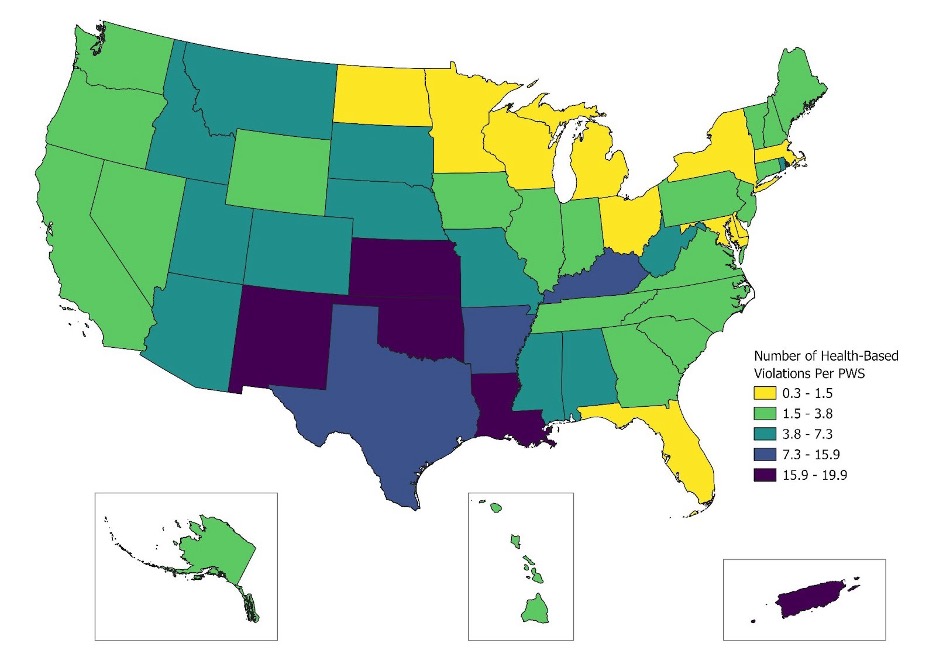
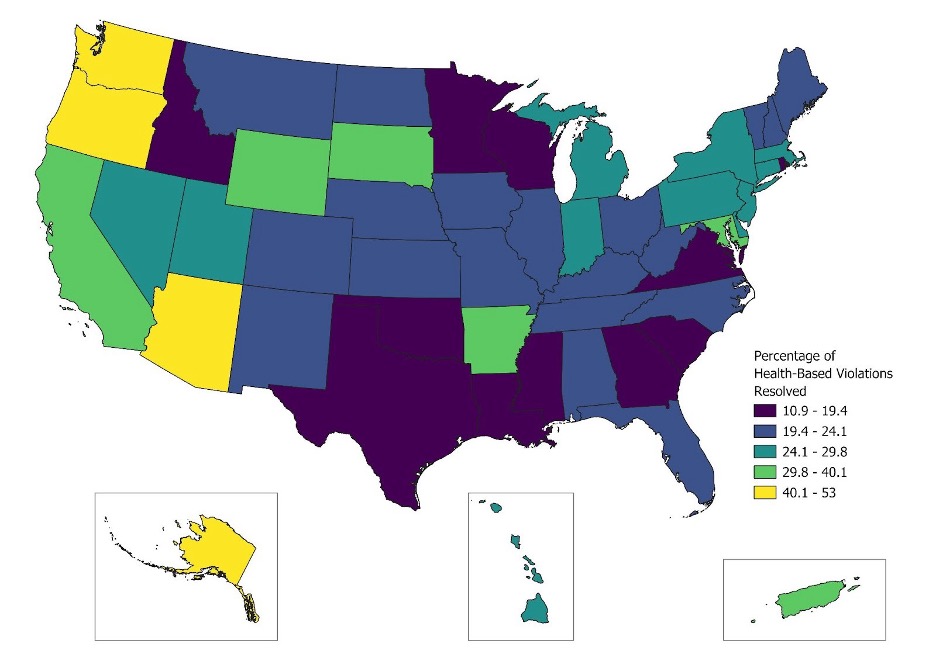
The highest health-based violation counts per PWS were in states in the South and Puerto Rico (Figure 8). The lowest health violation resolution rates occurred in the South, Southeast, Midwest, Idaho, and Rhode Island (Figure 9).
Drinking Water System Inspections
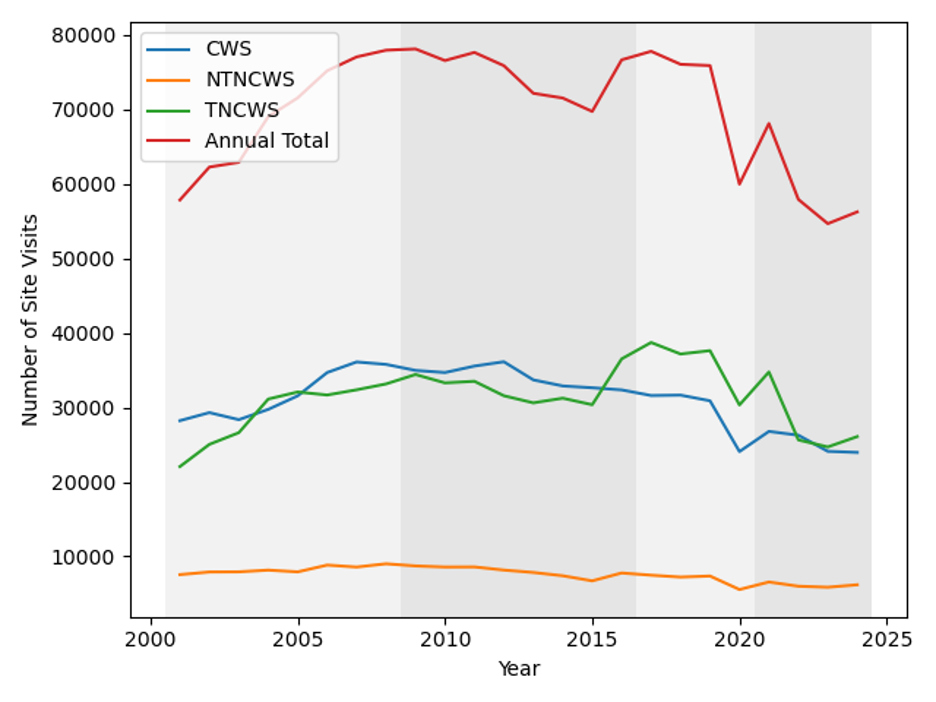
Site visits and system inspections by regulatory agencies may increase compliance with reporting requirements and resolution rate for violations. The total number of site visits increased through the Bush administration, mostly leveled off during Obama’s term, and then maintained during the first Trump administration until there was a precipitous drop in 2020. Numbers rebounded briefly at the start of the Biden administration but fell again the next year (Figure 10). Most of these site visits were conducted by local authorities, mainly states.
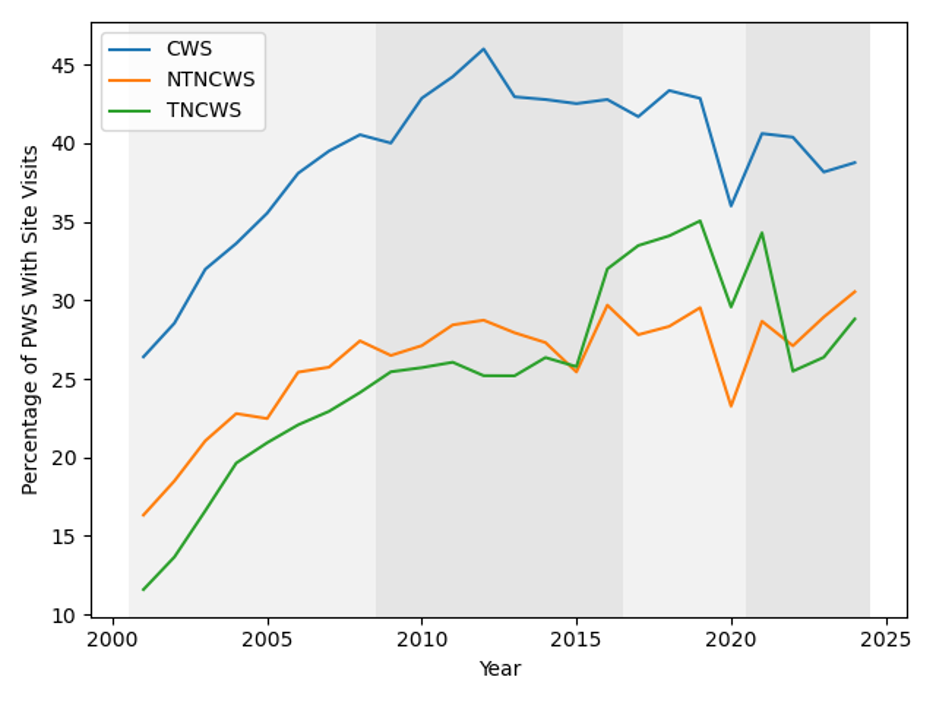
Site visit numbers reflect overall compliance effort, but a single site may account for multiple visits, so looking at the percentage of systems receiving at least one visit better reveals the overall reach of site visits (Figure 11). Over time, the patterns are similar to total numbers of visits. For CWS, the percentage of systems visited increased from 2001-2012, and then declined. The percentage of NTNCWS (systems serving non-residences with steady populations, such as schools) visited has increased over time, and the percentage of TNCWS (systems serving non-residences with changing populations, such as campgrounds) visited has also increased, with a temporary bump during the first Trump term. The vast majority of these site visits, for all system types, were associated with sanitary surveys, which the SDWA requires on a routine basis.
Drinking Water In Trump’s Second Term
The first Trump administration had a mixed record on drinking water. The America’s Water Infrastructure Act of 2018 reauthorized some water infrastructure funding programs, but the administration later cut similar funding (also noted here). The administration also weakened the Waters of the United States rule, increasing the threat of pollution in surface waters that are used as drinking water sources; removed surface and ground water impacts from chemical risk assessments; and suppressed information about drinking water contamination on military bases.
Thus far, the current Trump administration’s actions look similar in kind and greater in measure. Trump’s Inauguration Day executive order pausing distributions of financial assistance to communities affected $35 billion in Bipartisan Infrastructure Law (BIL) funding for drinking water system improvements. In May, EPA announced that it would roll back all but two of the PFAS drinking water standards that were finalized in 2023 under the Biden administration, and delay implementation of the remaining two standards. In its 2026 budget, the administration sought to completely eliminate federal funding for State Revolving Funds—a major source of state funding for water infrastructure improvements—proposing to retain a mere 10% of the previous funding level as an “offramp.” As she welcomed EPA Administrator Lee Zeldin to Environment and Public Works committee budget hearings, Senate EPW chair Shelley Moore Capito singled out this cut, emphasizing the certain damage it would do, but she ultimately voted in favor.
This administration has also delayed PFAS reporting requirements for chemical manufacturers and delayed the federal government’s defense of a “hazardous substance” designation for PFAS. The EPA is also pursuing multiple strategies to speed chemical approvals, increasing the risk that novel contaminants will be introduced into drinking water sources.
Conclusion
This analysis shows that drinking water quality is uneven across the United States. The state-level data shown here obscure more local patterns and do not address social and economic factors. Drinking water violations disproportionately occur in low-income and rural communities that are clustered in hotspots across the southwest, Appalachia, Alaska, and Puerto Rico and water quality violations occur at much higher rates in systems on tribal lands compared to other areas, even while enforcement is less rigorous. Recurring violations play an important role in these disproportionate impacts, reflecting the fact that these areas need greater access to funding to build and maintain infrastructure, and technical and management support.
The overall decline in drinking water quality violations since 2001 shows that the SDWA can enable progress once drinking water rules are in place. However, fewer violations are being resolved than in the past. This may be because non-binding actions account for a growing majority of enforcement activity, and non-routine site visits by enforcement agencies are rare. Both of these could encourage accountability on the part of drinking water systems. Fewer resolved violations may also reflect an increase in chronic water quality hotspots (as no new regulations have come into effect to prompt the bump in resolvable violations).
The low rate of Resolving violations and the increasing use of Informal enforcement actions suggest that stronger policies are needed to deal with drinking water violations. At the same time, the SDWA’s effectiveness at ensuring safe drinking water relies on the EPA to keep pace with the emergence of information about unregulated pollutants by adopting new drinking water standards. In this regard, the SDWA is not a success: The EPA has adopted only one new drinking water rule in the past two decades.
Since SDWA implementation is state-led, presidential priorities and federal control over drinking water are exerted more through standard-setting and budgets than direct involvement in enforcement and compliance. This analysis suggests that the deregulatory agenda being advanced by the Trump administration will further set back drinking water quality, especially in areas already disadvantaged.