EDGI’s Environmental Enforcement Watch (EEW) team hosted ‘Building Civic Technologies for Environmental Data Justice,’ a five-part workshop series that explored the tools they’re building for contextualizing hard-to-access EPA data. The tools focus on analyzing cumulative impacts, mapping schools near hazardous air pollutants, and summarizing enforcement of and compliance with laws like the Clean Air Act nationwide, by congressional district, and by watershed. See a demo of each one below.
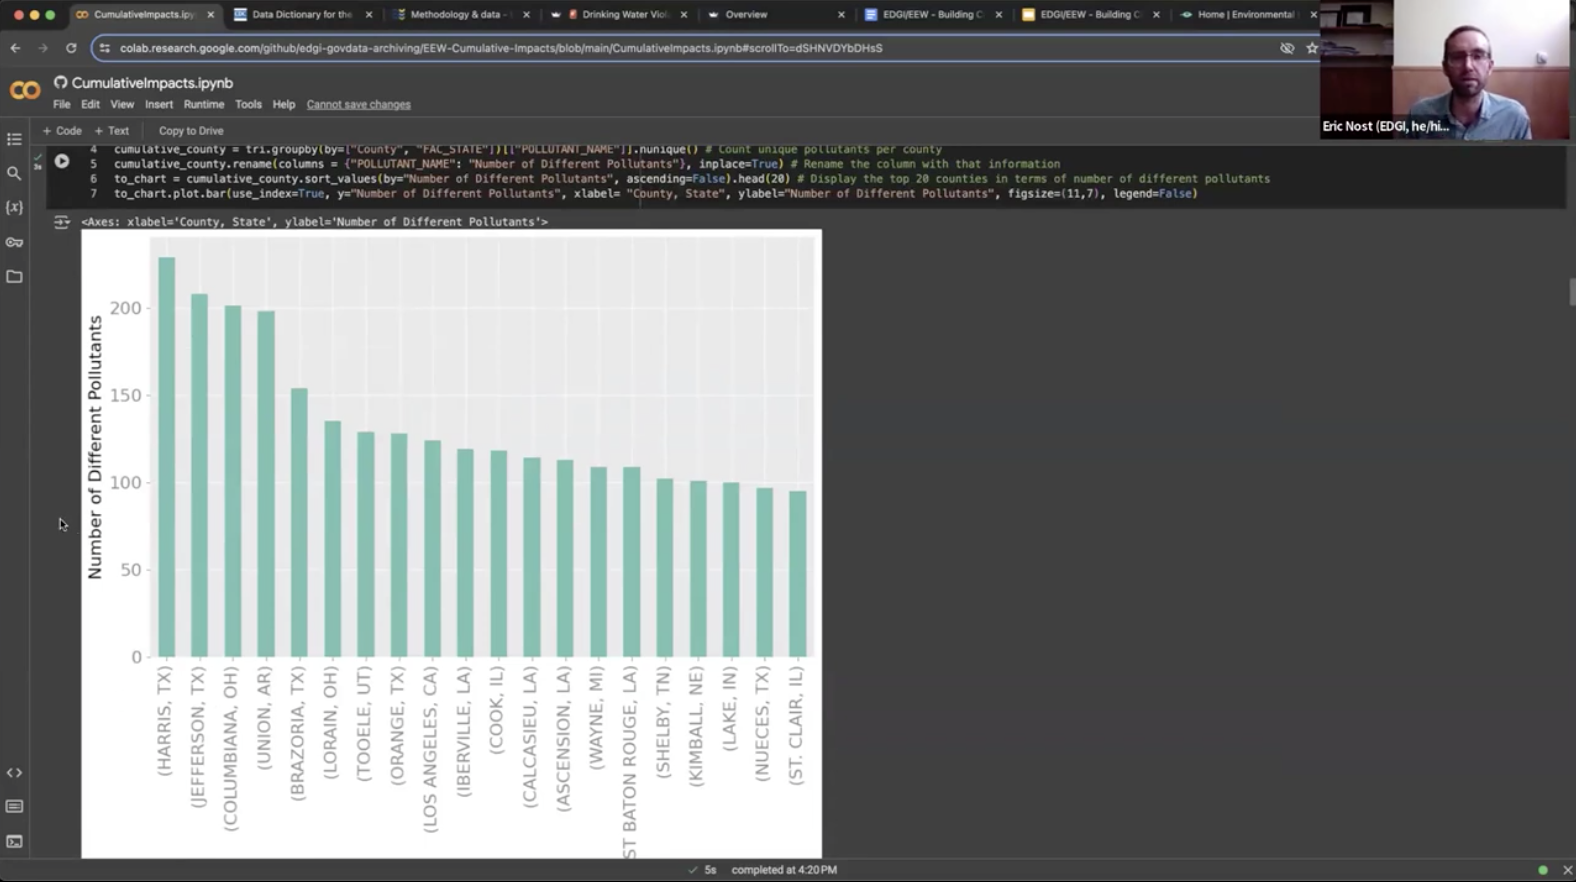
Cumulative Impacts Notebook Demo (7/31/24)
The Cumulative Impacts Notebook can answer questions like: how many different air pollutants have been reported released in the past 10+ years in any given place? Which companies own these industrial facilities? Where are the parent companies headquartered?
TRI and Schools Notebook Demo (8/14/24)
The TRI and Schools Notebook can answer questions like: how many students go to schools near industrial facilities that release hazardous air pollutants? What health impacts are those pollutants known to have?
The State of the Watersheds Notebook Demo (8/28/24)
The State of the Watersheds Notebook can answer questions like: which watersheds experience the most violations of the Clean Water Act? What sorts of pollutants are discharged into those watersheds?
Nationwide Trends Over Time Notebook Demo (9/11/24)
The Nationwide Trends Over Time Notebook can answer questions like: how many inspections under the Clean Air/Water Acts do EPA/state agencies conduct? How frequently are regulated facilities in violation of those acts?
Congressional Report Cards Notebook Demo (9/25/24)
The Congressional Report Cards Notebook can answer questions like: has the Biden administration done a better job of enforcing environmental protection laws than Trump? What does this look like in your congressional district?
We would love to hear from you! To get in touch or contribute to this work, please email EEW at environmentalenforcementwatch@gmail.com.

