
October 28, 2025
By Lelia Marie Hampton and Eric Nost
Key Points
- Communities living in close proximity (i.e., one mile) to EPA-regulated data centers have higher air pollution burdens compared to the national median (i.e., 50th percentile of air pollution).
- In particular, communities of color within one mile of EPA-regulated data centers face worse air pollution than other communities near data centers and the typical (median) community in the country. These trends are relatively consistent, but not as pronounced when considering state-specific averages.
- Low-income communities within one mile of EPA-regulated data centers do not have a statistically significant association with air pollution at the national level, but they do tend to face higher levels of nitrogen dioxide and diesel particulate matter (PM) than other parts of the states where they are located.
Data centers are booming right now due to climbing demand for generative AI, cryptocurrency mining, and cloud computing services. The U.S. houses almost half of the world’s data centers, including the “data center capital of the world” in Virginia. These data centers are often built in close proximity to communities who experience heightened air and noise pollution, strained water resources, and increased energy costs. Despite these ongoing community impacts, relatively little analysis has examined the intersection of demographic and environmental dynamics of U.S. data centers.
To address this gap, we accessed information on 550 data centers, accounting for just under 10% of all US data centers. Unlike xAI’s Colossus facility in Memphis, Tennessee, these 550 data centers have been permitted by state and federal environmental protection agencies—in theory, they should be held to pollution standards and should not overburden communities. About 4 million people live within one mile of these data centers. To examine the air pollution burden of these communities, we consider local levels of fine particulate matter (PM2.5), nitrogen dioxide (NO2), and diesel combustion-based particulate matter levels. Specifically, we examined air pollutants associated with diesel exhaust, since data centers often use diesel generators as backup power sources. Moreover, some data centers have onsite power generators, like xAI’s gas turbines, which also emit NO2. We found that the communities within one mile of data centers not only tend to be disproportionately communities of color—relative to the national median—but also face particulate matter, nitrogen dioxide, and diesel particulate matter levels above the national median. We also found that residents within one mile of the examined data centers were usually not disproportionately low income compared to national rates. Notably, Project 2025 asserted that race should not be considered in environmental justice review (which the Trump administration has all but abandoned anyway). Yet from heat islands to flooding to air pollution, people of color tend to face heightened environmental and climatic burdens, even when considering socioeconomic status.
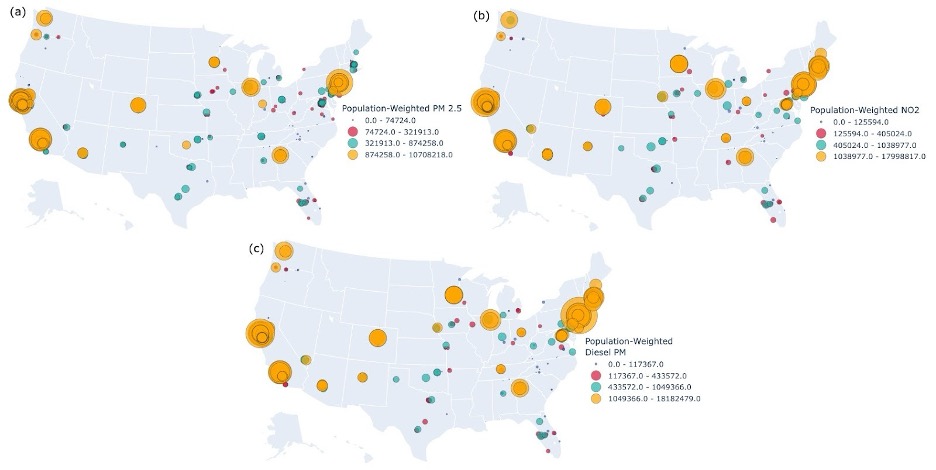
Figure 1 shows the population-weighted air pollution for (a) PM2.5, (b) NO2, and (c) diesel PM in neighborhoods around data centers. Population-weighting is a common metric to indicate human exposure to air pollution. Here, we see the greatest population to air pollution exposure largely centered around heavily populated urban areas.
Association of Air Pollution with Demographics
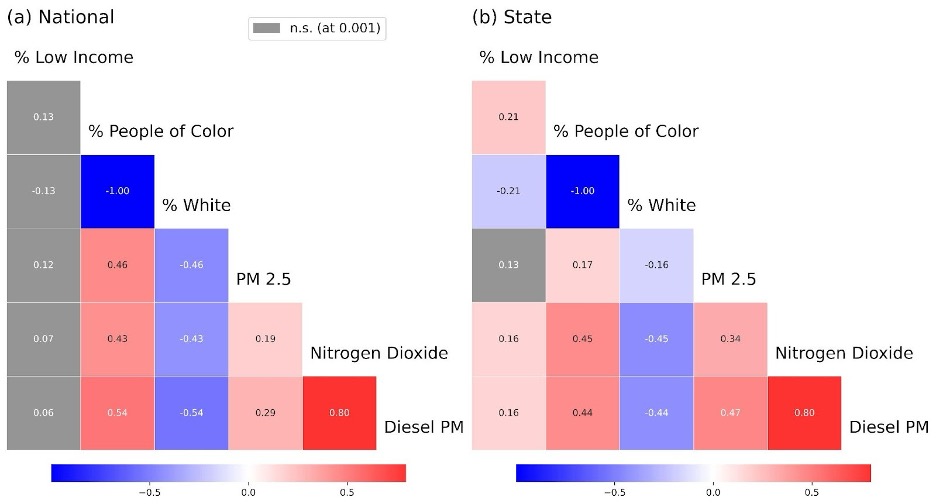
Figure 2 shows Pearson’s rank correlations of demographic and air quality variables for national and state percentiles of Census block groups within one mile of data centers, respectively. Statistically insignificant values (at p>0.001) are displayed in gray. In Census block groups within one mile of data centers, we found that the rank for percent people of color (POC) is positively associated with air pollution, namely PM2.5, NO2, and diesel PM, which are statistically significant at p<0.001. On the contrary, the rank for percent white is negatively associated with these air pollutants in both national and state contexts. For national ranks, we did not find a statistically significant association between low income percentage and air pollution near data centers. However, we did find statistically significant positive associations at the state level between low income communities and nitrogen dioxide and diesel particulate matter.
Race-weighted Average Air Pollution Ranks
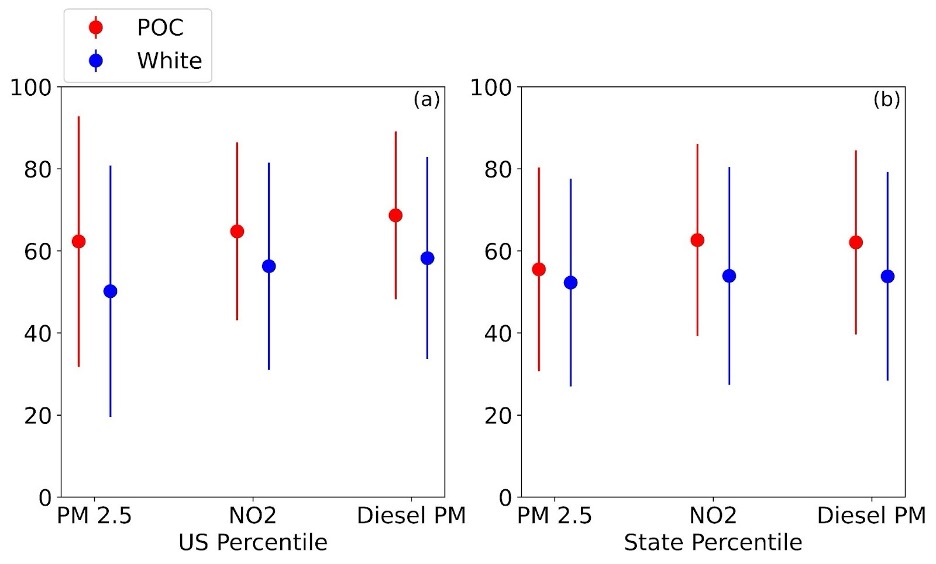
Figure 3 shows race-weighted means and standard deviations for (a) national and (b) state percentiles of PM 2.5, NO2, and diesel PM. All differences between POC and white across air quality metrics in national and state contexts are statistically significant at p<0.0001, according to a two-sample t-test. We find that both groups tend to be atypical relative to national and state pollution levels, but people of color near data centers tend to experience higher air pollution rates compared to their white counterparts. This trend is less pronounced at the state level when comparing air pollution levels to statewide values.
Distribution of Air Pollution Ranks by Race
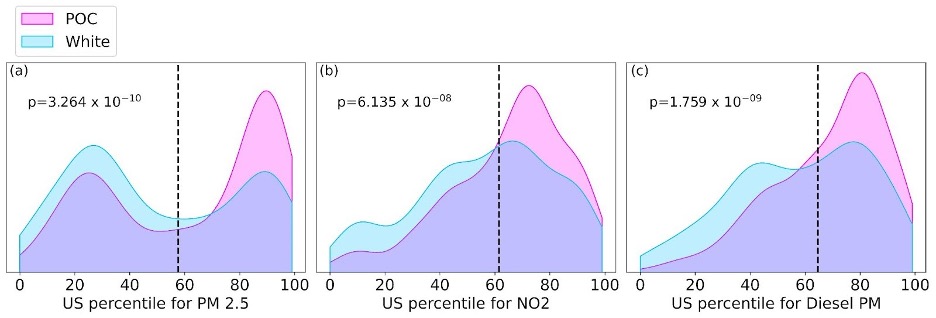
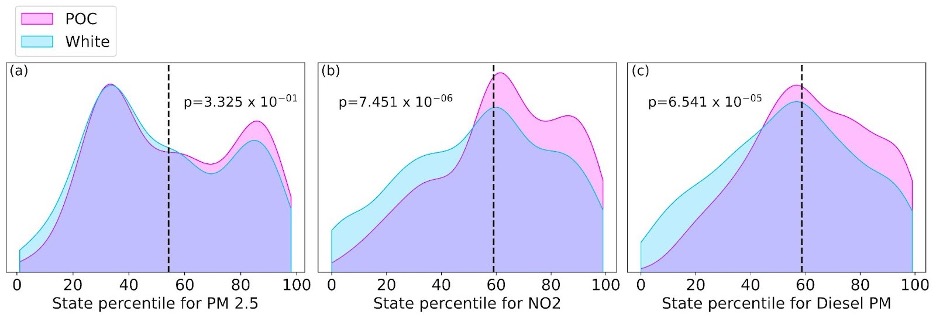
We see that across air quality indicators the difference between POC and white people within one mile of data centers is statistically significant (Figure 4). The distribution of air pollution for people of color is heavily skewed beyond the average national percentile for the sample, and even the average national percentile for the sample is above the 50th percentile. The neighborhoods around data centers that, compared to the U.S. as a whole, face exceptionally high air pollution levels are disproportionately communities of color.
Examining Figure 5, we find that the PM2.5 burden in state contexts is similar for both racial groups: The peak of the distribution falls below the average state percentile for PM2.5 for the sample, but there is still a large number of both white and Black residents in the sample falling above the 80th percentile of PM2.5 in their respective states (indicated by a second peak in the distribution on the right). Moreover, people of color disproportionately face higher NO2 and diesel PM. In fact, there seems to be a greater burden of NO2 when considering state percentile ranks. For diesel PM, there is slightly less burden compared to the national level, but there seems to be a number of communities at the highest exposure levels (e.g., above the 90th percentile).
Trends of Air Pollution Ranks by Race
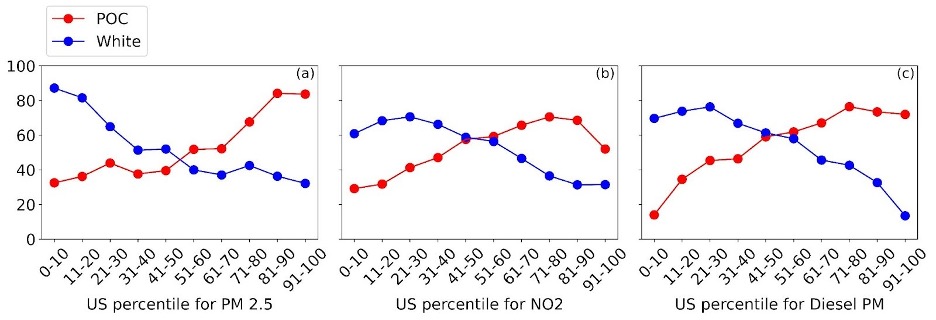
In census block groups within one mile of data centers, we found an increasing trend line for people of color experiencing PM2.5, NO2, and diesel PM pollution, compared to a decreasing trend line for white people at the national level. In other words, when we look at all the neighborhoods within one mile of data centers, as we look at increasingly polluted neighborhoods (in the context of the whole US), we see that they are overwhelmingly (in the context of the whole US) non-white.
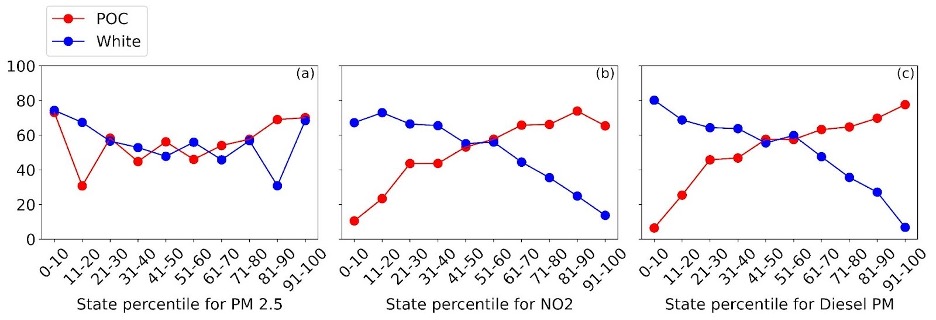
In census block groups within one mile of data centers, we found an increasing trend line for people of color experiencing NO2 and diesel PM, compared to a decreasing trend line for white people at the state level for NO2 and diesel PM. Compared to the national level, the increasing trend of NO2 for people of color is much stronger. The trend is less consistent for PM2.5 for either racial group at the state level.
Steps Forward
Air quality issues for those within close proximity to data centers, especially people of color, are definitely concerning and should be addressed. Evidence-based policy should inform air pollution mitigation near data centers. Existing data centers should seek to lower their environmental burden on local communities and consider renewable energy alternatives. Local decision makers should be mindful of both existing air pollution burdens from industry as well as the air pollution burdens of data centers themselves prior to building them in local communities. A critical issue is that marginalized communities with limited resources will have less resources to mitigate and respond to air quality issues resulting from data centers. For example, low income communities impacted by data centers may not have the funds for indoor air purifiers. Moreover, decision-makers should weigh the social costs of air pollution, including the increased burden on public health systems, and thus taxpayers, due to illness associated with environmental degradation.
***Notes on Methodology: We queried the archived EPA Environmental Justice Analysis Multisite (EJAM) tool with the North American Industrial Code System (NAICS) code for data centers (518210). We restricted our query to examine communities within one mile of each data center. Thus, the data centers represented here are those regulated by the EPA based on existing statute (e.g., Clean Air Act, Clean Water Act). The output included average demographics and environmental burdens with respect to census block groups. We note that this tool does not contain location information on all U.S. data centers, limiting the generalizability of this analysis. Our analysis is dependent on the proximity constraint of one mile, and results may differ at lesser or greater distances. The air quality indicators are not specific to emissions from data centers. Since we conduct an aggregate national analysis, several impacted communities may be “averaged” away. For example, there are low income communities within one mile of data centers who suffer air pollution, but on average within our specific sample, it is not immediately apparent. Further analysis is needed to disaggregate direct pollution burden from data centers. We plan to address some of these shortcomings in future analysis.